Free Access
Fig. 3
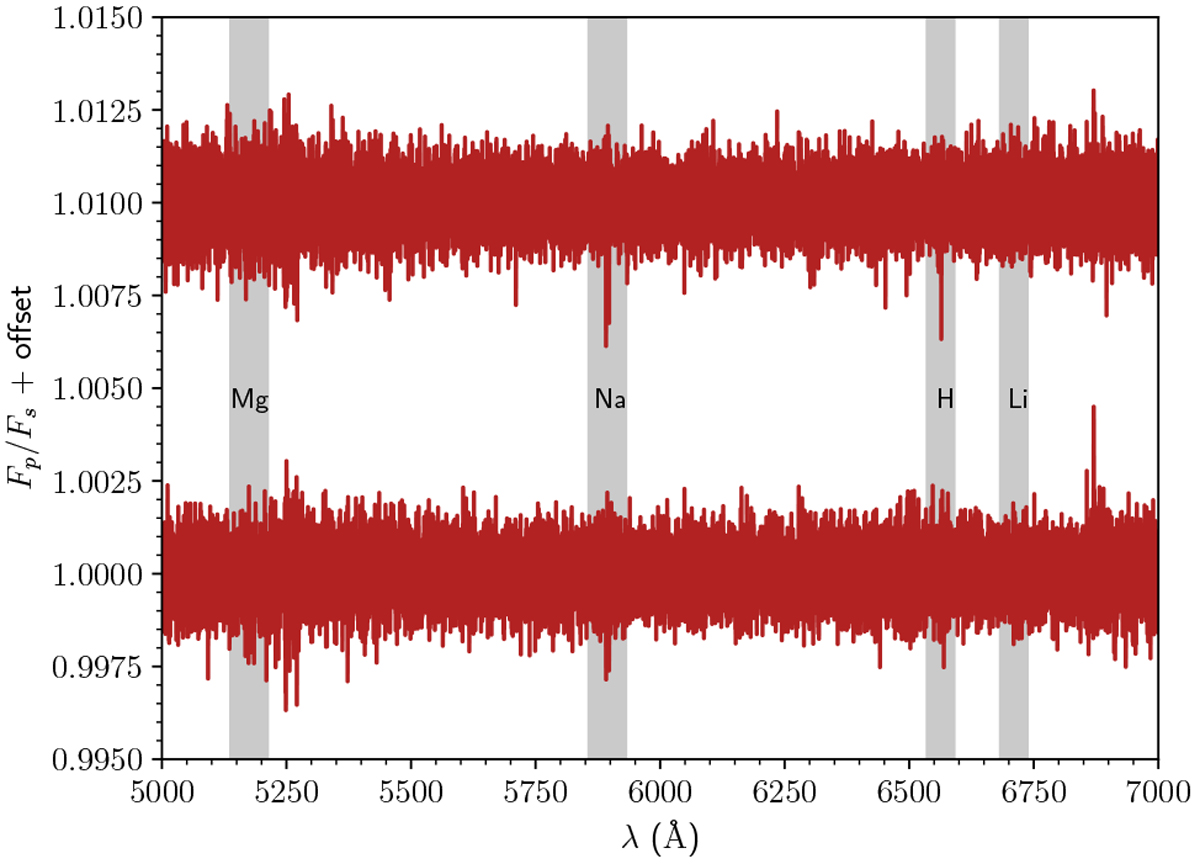
Transmission spectra for WASP-76b in the 5000–7000 Å range: a fewkey features are shaded in grey. The T1 is the top spectrum and T2 is the bottom one. A binning of 0.1 Å has been applied to the data for clarity. All wavelengths are given in vacuum.
Current usage metrics show cumulative count of Article Views (full-text article views including HTML views, PDF and ePub downloads, according to the available data) and Abstracts Views on Vision4Press platform.
Data correspond to usage on the plateform after 2015. The current usage metrics is available 48-96 hours after online publication and is updated daily on week days.
Initial download of the metrics may take a while.