Fig. 9.
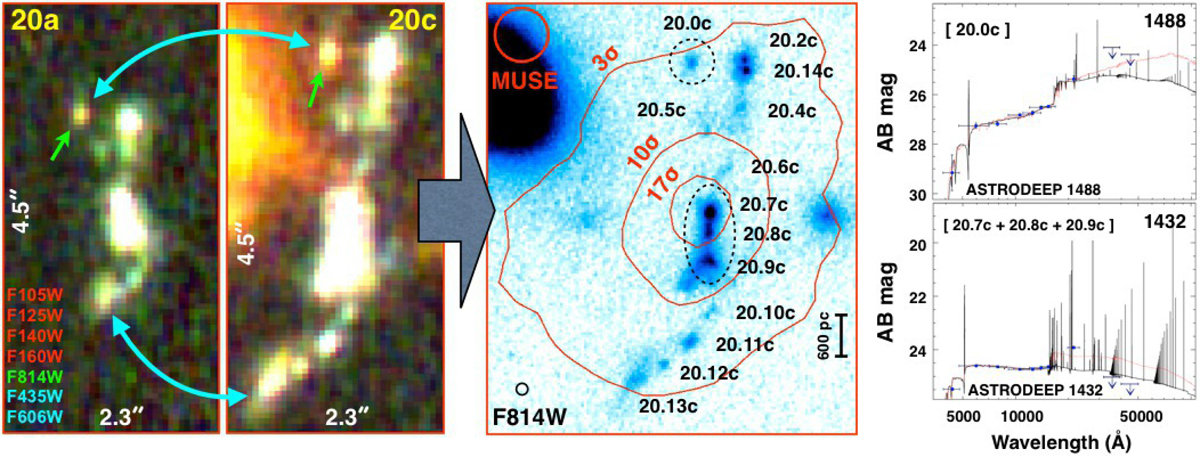
Example of a magnified z = 3.222 galaxy (source 20). Deep color RGB images of components 20a and 20c are shown in the two leftmost panels; the knot showing a redder color with respect to the rest of the galaxy is marked with a green arrow. Cyan arrows mark the two extremes of the structure, indicating the corresponding physical regions. Middle panel: F814W blue color-code HST image details the most magnified component 20c, in which at least 13 clumps are identified, across a region of 8 physical kpc on the source plane. The contours are drawn from the MUSE Lyα emission. The MUSE and ACS/F184W PSF sizes are indicated with a red (top-left) and black (bottom-left) circles. The SED-fits (from the ASTRODEEP photometric catalog, Castellano et al. 2016) of two regions marked with dashed black ellipses are shown in the rightmost panels. The mirrored symmetry between images 20a and 20c confirms that all clumps belong to the galaxy, including knot 20.0 showing a clearly different color (see SED fits). The physical scale is reported on image F814W, bottom-right (1 HST pixel corresponds roughly to 60 pc along the vertical extension of the galaxy in the source plane).
Current usage metrics show cumulative count of Article Views (full-text article views including HTML views, PDF and ePub downloads, according to the available data) and Abstracts Views on Vision4Press platform.
Data correspond to usage on the plateform after 2015. The current usage metrics is available 48-96 hours after online publication and is updated daily on week days.
Initial download of the metrics may take a while.