Fig. 8.
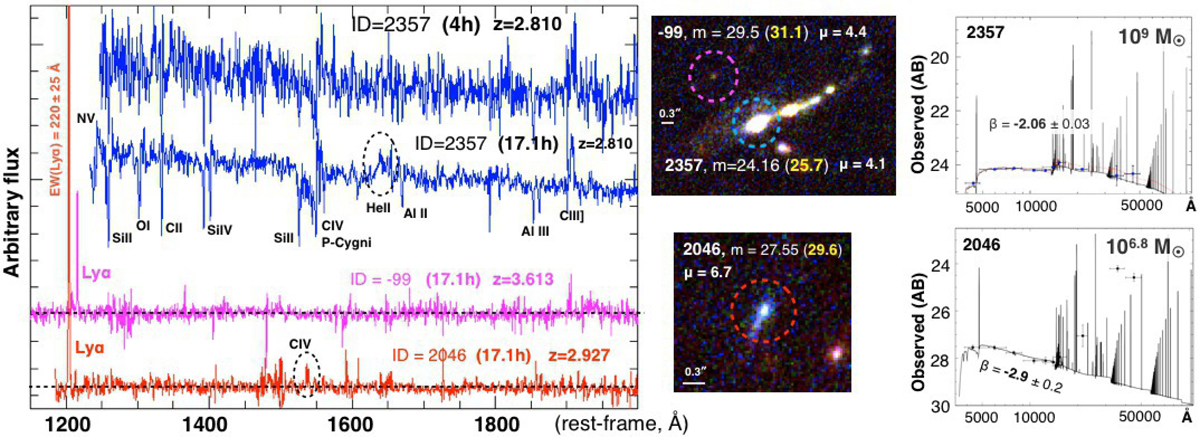
Examples of MUSE spectra of moderately magnified sources not producing multiple images. Left panel: one dimensional spectra are color coded accordingly to the dashed circles marking the sources in the HST color images (middle panels). The spectrum of source 2357 from four hours of integration without AO is compared with the one from the MDLF full depth (17.1 h) including AO (the P Cygni profile of the C IV is affected by the increased noise due to laser AO correction). The deep spectrum shows many features in absorption, whereas in emission, the C III]λλ1907, 1909 and broad He IIλ1640 (marked with a dashed ellipse) are clearly detected, as well as a possible P Cygni of the [N V]λλ1239, 1243, close to the blue edge of the spectral coverage. Two other faint objects, 2046 and −99, are shown with magenta and red colors. The observed(intrinsic) magnitude is shown in the middle panels, with the intrinsic one reported with a yellow color. Source 2046, with m1500 = 31.1 ± 0.3, shows a large Lyα equivalent width of 220 ± 25 Å rest-frame and a very steep ultraviolet slope, β = −2.9 ± 0.2. Nebular C IVλ1548, 1550 doublet is also detected for this object (see dashed ellipse on the red spectrum). Rightmost panels: SED fits and magnitudes as performed by Castellano et al. (2016). The red spectrum is blueshifted by 12 Å with respect to the other spectra for illustrative purposes.
Current usage metrics show cumulative count of Article Views (full-text article views including HTML views, PDF and ePub downloads, according to the available data) and Abstracts Views on Vision4Press platform.
Data correspond to usage on the plateform after 2015. The current usage metrics is available 48-96 hours after online publication and is updated daily on week days.
Initial download of the metrics may take a while.