Fig. 7.
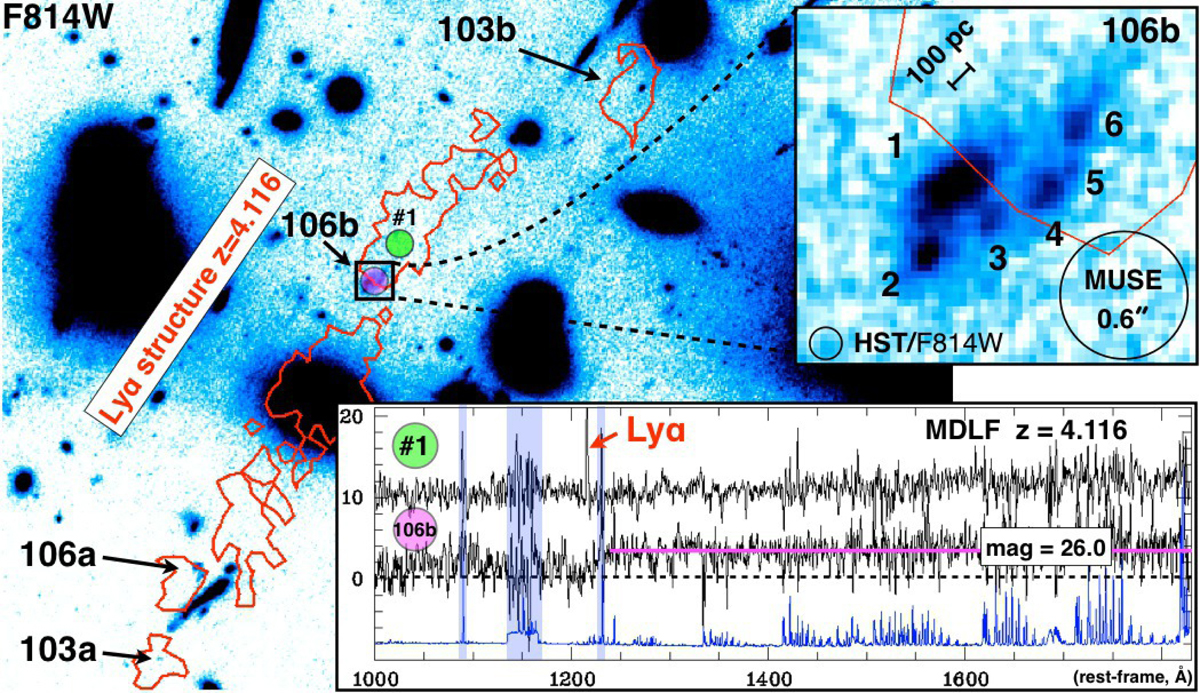
Lyα nebulae (red contours at 2-σ level) including images 106(a,b) and 103(a,b), belonging to the same physical structure at z = 4.116, are shown in the main panel (HST ACS/F814W band). In the top-right inset, the lensed galaxy 106b broken in six clumps is shown; the smaller ones (2 − 6) have intrinsic UV magnitude ≃30.5 − 31 (corresponding to MUV ≃ −15) and intrinsic sizes of the order of (or smaller than) 100 pc along the tangential stretch, as indicated by the ruler. The bottom inset shows two one-dimensional spectra extracted from the MDLF. One is on galaxy 106b (within a circular aperture of 1.2″ diameter, see magenta circle). We note the ultraviolet continuum of 106b with F814W = 26.01 ± 0.03 is well-detected (magenta line) above the zero level (black dashed line), and its continuum-break confirmed at z = 4.116. The top spectrum is extracted from a nearby region showing Lyα emission without HST counterpart (green circle with 1.2″ diameter, labeled as #1), vertically shifted at position 10 for illustrative purposes. The error spectrum is shown in blue at the bottom to highlight the location of the sky emission lines. The shaded band marks the wavelength region affected by the GLAO sodium-based laser.
Current usage metrics show cumulative count of Article Views (full-text article views including HTML views, PDF and ePub downloads, according to the available data) and Abstracts Views on Vision4Press platform.
Data correspond to usage on the plateform after 2015. The current usage metrics is available 48-96 hours after online publication and is updated daily on week days.
Initial download of the metrics may take a while.