Fig. 5.
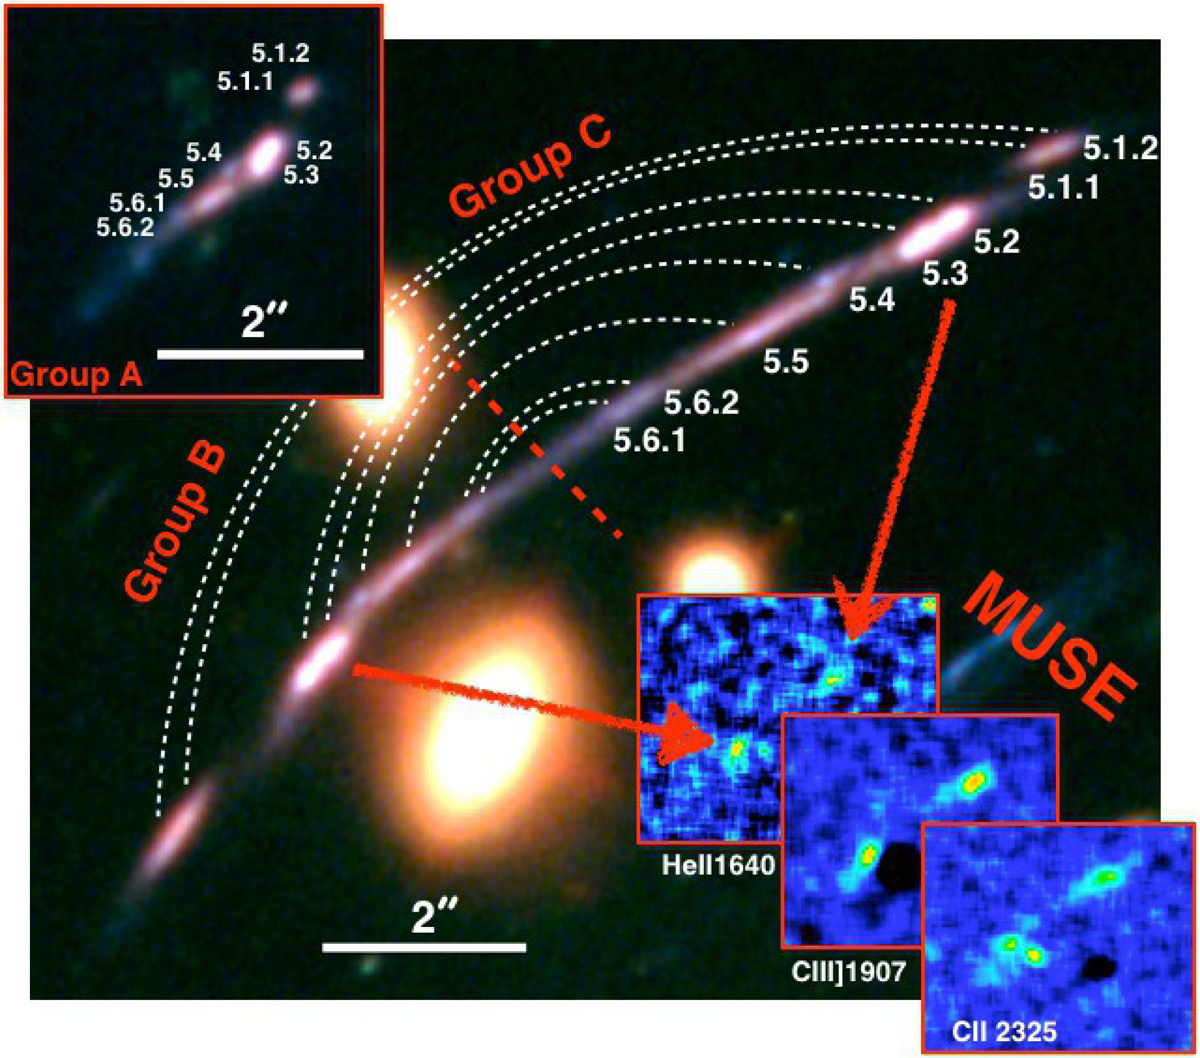
Eight clumps identified for source 5 are marked with IDs 5.1.2, 5.1.1, 5.2, 5.3, 5.4, 5.5, 5.6.2, 5.6.1 and indicated on both sides of the critical line (red dashed line), labeled as group C (5c) and B (5b). The top-left inset shows on the same scale the least magnified image 5a, in which all the corresponding clumps can be recognized. The bottom-right insets show the continuum-subtracted narrow-band images extracted from MUSE around the wavelength of the most prominent high ionization emission lines.
Current usage metrics show cumulative count of Article Views (full-text article views including HTML views, PDF and ePub downloads, according to the available data) and Abstracts Views on Vision4Press platform.
Data correspond to usage on the plateform after 2015. The current usage metrics is available 48-96 hours after online publication and is updated daily on week days.
Initial download of the metrics may take a while.