Fig. E.1.
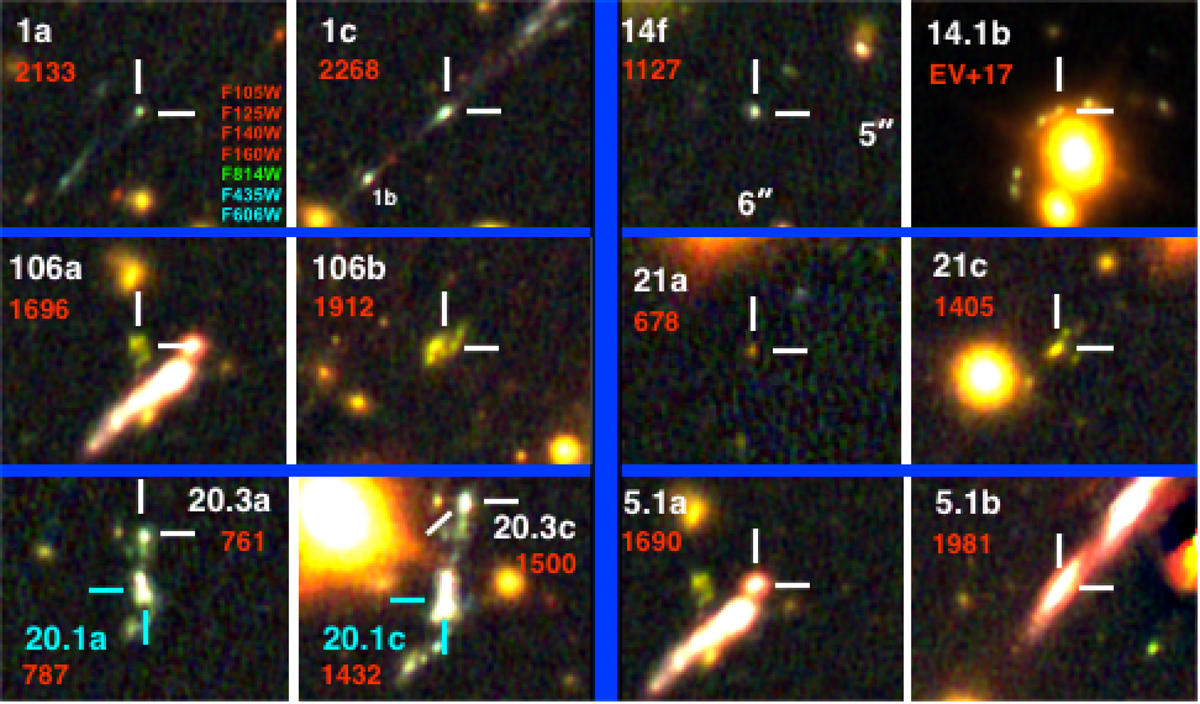
RGB HST images reported in Table E.1 are shown on two columns (divided by the vertical blue bar). The least magnified image of source 1 is shown on the top-left (1a), and the most magnified (1c) in the adjacent cutout on the right. The same applies for the other images. The size of the cutouts is 6″ × 5″. The ASTRODEEP identifier is quoted in red, while our internal ID is in white. For source 20 (bottom-left), two clumps are reported: 20.3a, 20.3c (marked with white segments), and 20.1a, 20.1c (cyan segments).
Current usage metrics show cumulative count of Article Views (full-text article views including HTML views, PDF and ePub downloads, according to the available data) and Abstracts Views on Vision4Press platform.
Data correspond to usage on the plateform after 2015. The current usage metrics is available 48-96 hours after online publication and is updated daily on week days.
Initial download of the metrics may take a while.