Fig. D.2.
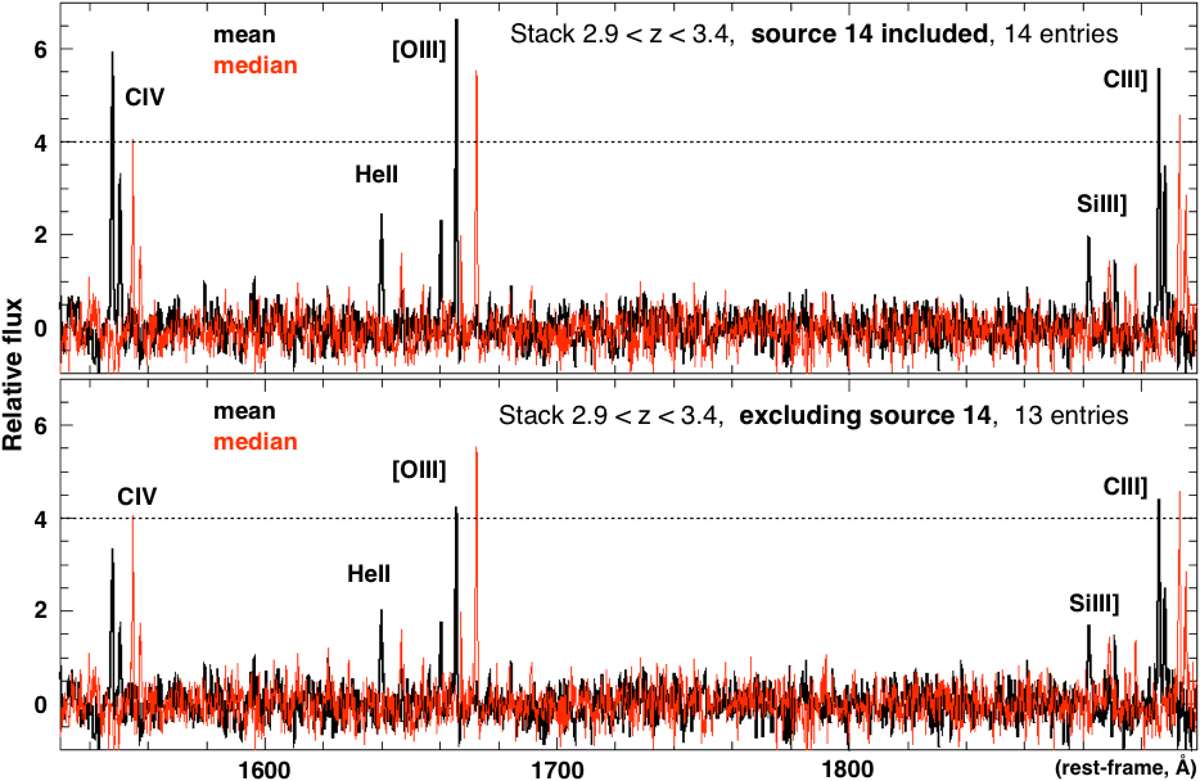
Mean (black line) and median (red line) stacked detection maps calculated from the set of spectra reported in Fig. D.1. The zoomed region including C IVλ1548, 1550, He IIλ1640, O III]λ1661, 1666, and C III]λλ1907, 1909 (from left to right) is shown. Top panel: all sources are included (14 entries), while in the bottom panel source 14 is excluded, that is the source showing prominent nebular high-ionization lines (see Fig. C.1, spectrum in blue; see also Fig. D.1). The median stacks (red lines) are rigidly redshifted by a fixed quantity for illustrative purposes only.
Current usage metrics show cumulative count of Article Views (full-text article views including HTML views, PDF and ePub downloads, according to the available data) and Abstracts Views on Vision4Press platform.
Data correspond to usage on the plateform after 2015. The current usage metrics is available 48-96 hours after online publication and is updated daily on week days.
Initial download of the metrics may take a while.