Fig. D.1.
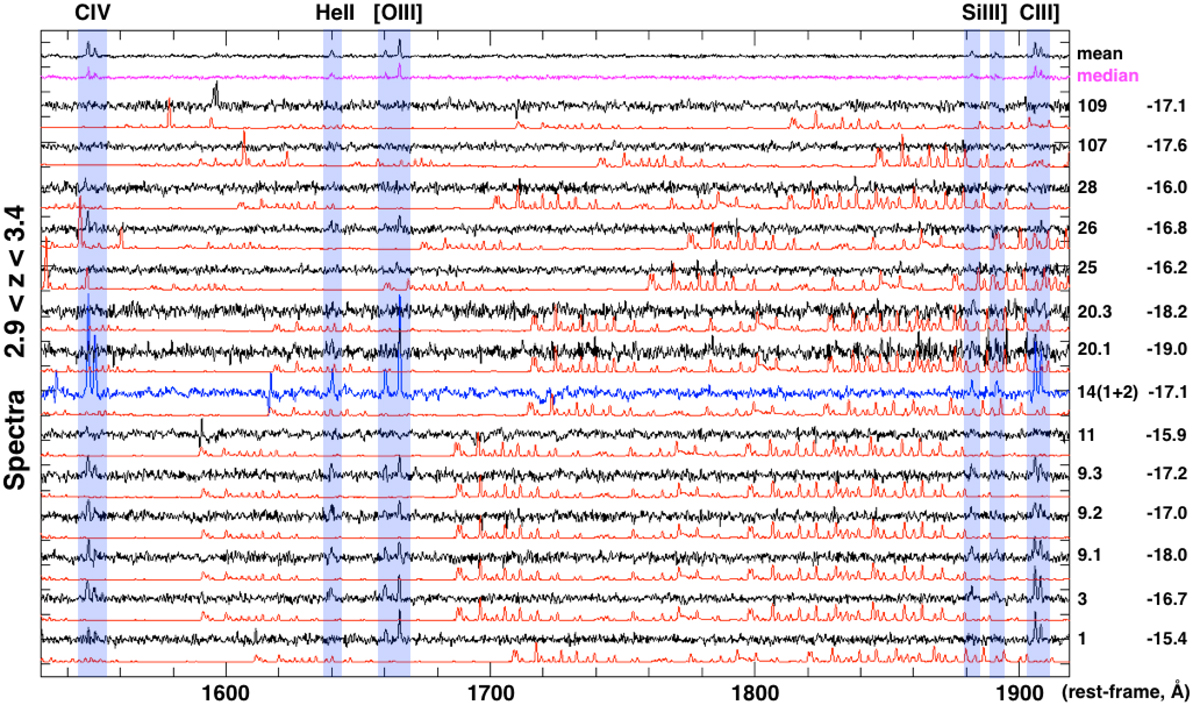
One-dimensional spectra (black lines) of a subset of sources with 2.9 < z < 3.4 and average absolute magnitude MUV = −17, shown versus the rest-frame wavelength. Each spectrum is the weighted average of multiple images eventually producing net integration time of 17.1 − 51.3 h each. The ID and absolute magnitudes are reported on the rightmost two columns. The red lines show the error spectra associated to each spectrum, properly scaled and shifted for clarity below each black line. The red spectra show the pattern of the skylines. The blue spectrum indicates source 14, in which the high-ionization lines are prominently detected (see Fig. D.2 and relative caption for details). The two spectra on the top panel are the mean (black) and median (magenta) of the sample included in this figure. The vertical transparent stripes mark the location of the typical high-ionization lines (labeled on the top axis).
Current usage metrics show cumulative count of Article Views (full-text article views including HTML views, PDF and ePub downloads, according to the available data) and Abstracts Views on Vision4Press platform.
Data correspond to usage on the plateform after 2015. The current usage metrics is available 48-96 hours after online publication and is updated daily on week days.
Initial download of the metrics may take a while.