Fig. C.1.
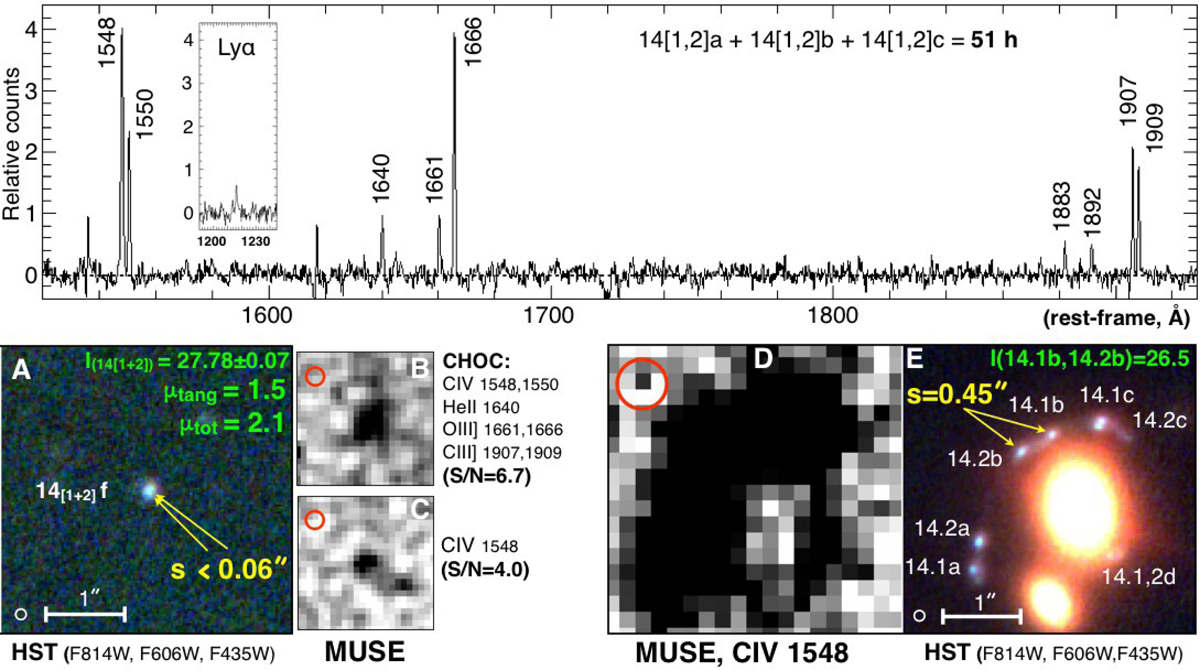
Revisited analysis of the double lensed source 14, made of a pair of knots, at the depth of MDLF. Top panel: continuum-subtracted one-dimensional spectrum of the pair obtained from the sum of the three multiple images 14a + 14b + 14c, equivalent to ≃51 h of integration. High-ionization lines are detected at S/N ∼ 10 − 50, while the inset shows the deficient Lyα emission (the same scale on Y-axis is adopted), ∼8 times fainter than C IVλ1548, or ∼4 times fainter than C III]λ1907. Bottom-left panel A: HST color image (red = F105W, green = F814W, blue = F606W) for the least magnified image (image 14[1 + 2]f), where the upper limit on the separation between knots 1 and 2 is quoted (s < 0.06″). Panels B and C: narrow-band (NB) continuum-subtracted MUSE images of the same 14[1 + 2]f, centered at the C IVλ1548 line and at the weight average of seven lines (the CHOC complex, see text for details). The NB images have been smoothed with a Gaussian kernel (σ = 1 pix). The red circles indicate the MUSE PSF of ![]() . The same HST color image for the most magnified images 14.2b and 14.1b is shown in the bottom-right E panel, while the corresponding C IVλ1548 MUSE narrow-band image is in panel D. The small open white circle shown in the HST cutouts marks the F814W PSF.
. The same HST color image for the most magnified images 14.2b and 14.1b is shown in the bottom-right E panel, while the corresponding C IVλ1548 MUSE narrow-band image is in panel D. The small open white circle shown in the HST cutouts marks the F814W PSF.
Current usage metrics show cumulative count of Article Views (full-text article views including HTML views, PDF and ePub downloads, according to the available data) and Abstracts Views on Vision4Press platform.
Data correspond to usage on the plateform after 2015. The current usage metrics is available 48-96 hours after online publication and is updated daily on week days.
Initial download of the metrics may take a while.