Fig. B.2.
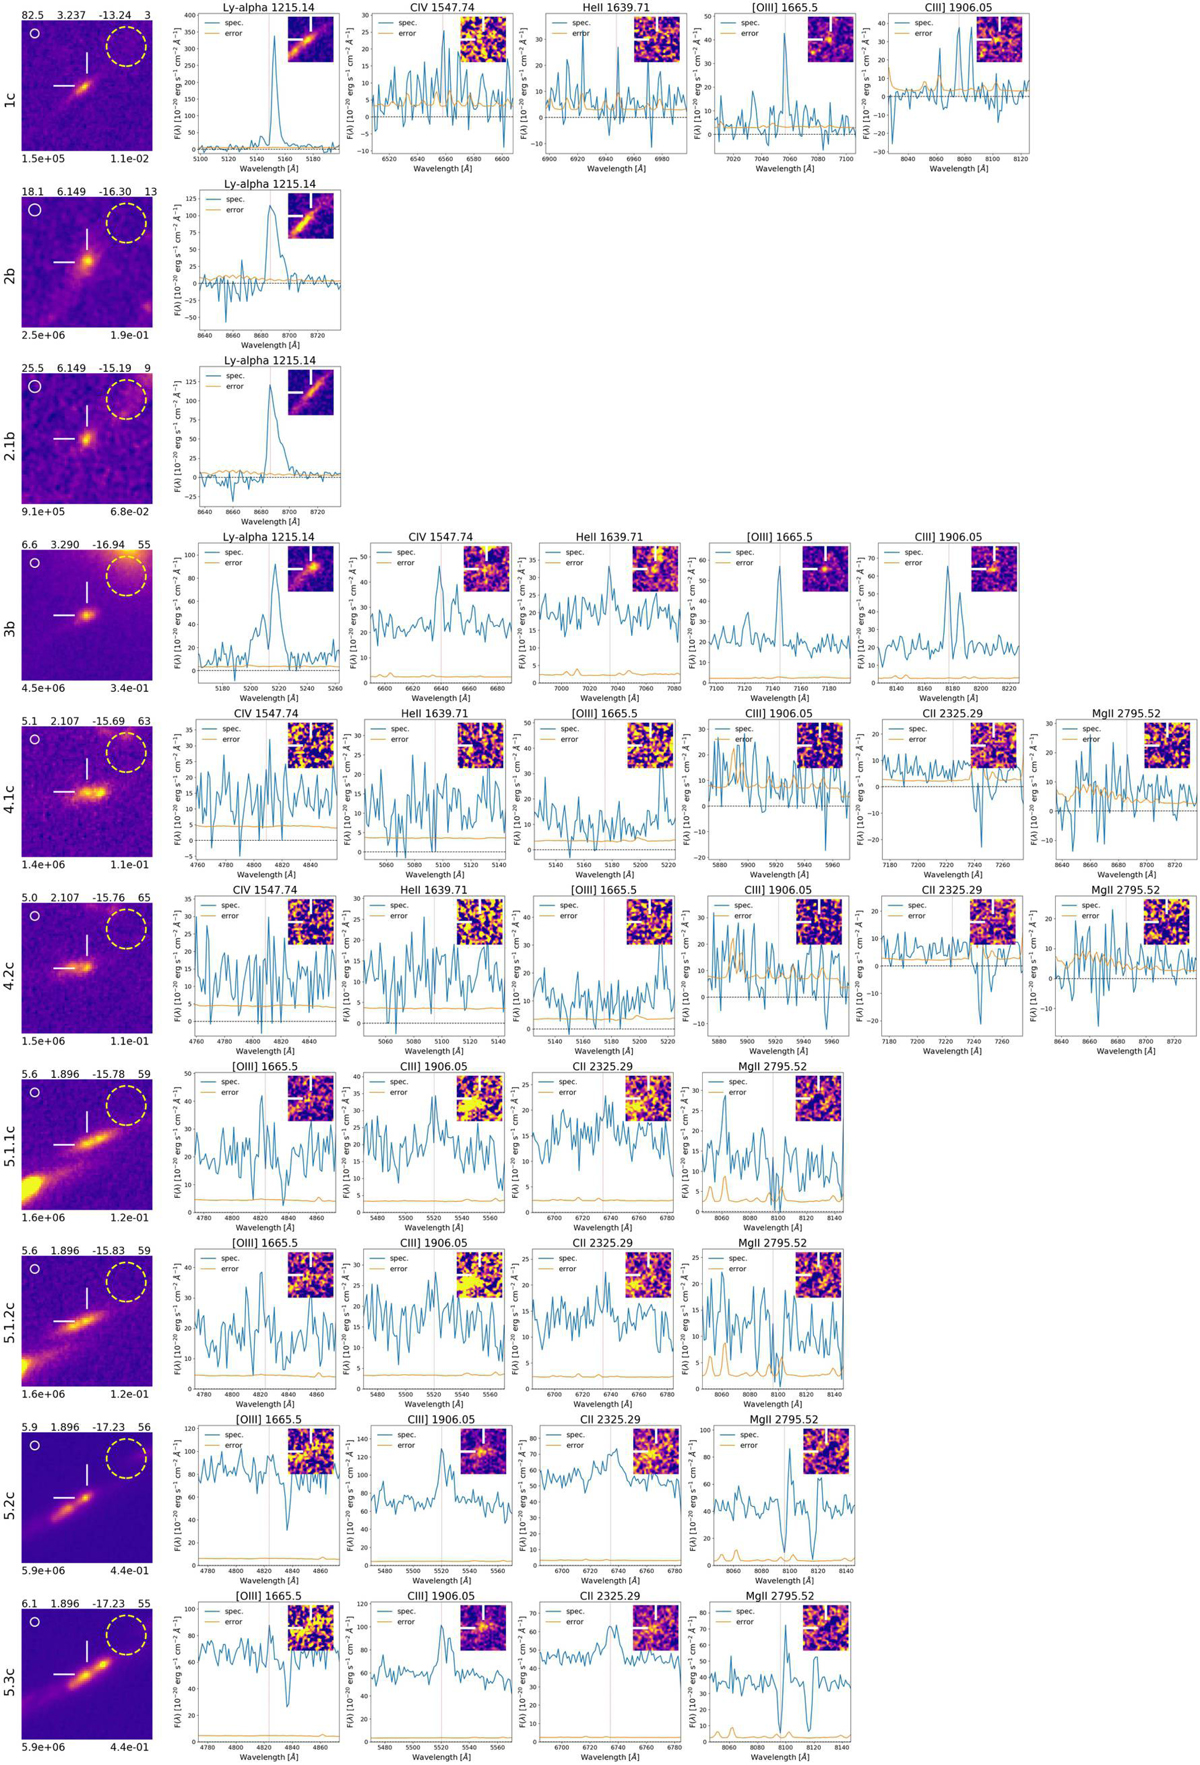
Summary of the individual star-forming clumps identified among the multiple images. Each row reports from left to right the square HST cutout of 1″ size and the extracted one-dimensional spectra zoomed at the positions of the most relevant atomic transitions probed by MUSE. The HST cutout shows the clump ID on the left, and clockwise, the magnification, redshift, absolute magnitude, parsec per 30 milliarcsecond (1 HST pix), the SFR (in units of M⊙ yr−1), and the stellar mass M(M⊙) (see text for details about the calculation of SFR and M). The circle in the top-right reports the F814W(F105W) PSF in case of z < 5.2(> 5.2), while the yellow dashed indicates the MUSE PSF. MUSE spectra (blue) and error (orange) are shown for the most relevant lines depending on redshift. The insets are the corresponding MUSE NB images of the lines (as described in Fig. A.1).
Current usage metrics show cumulative count of Article Views (full-text article views including HTML views, PDF and ePub downloads, according to the available data) and Abstracts Views on Vision4Press platform.
Data correspond to usage on the plateform after 2015. The current usage metrics is available 48-96 hours after online publication and is updated daily on week days.
Initial download of the metrics may take a while.