Fig. B.1.
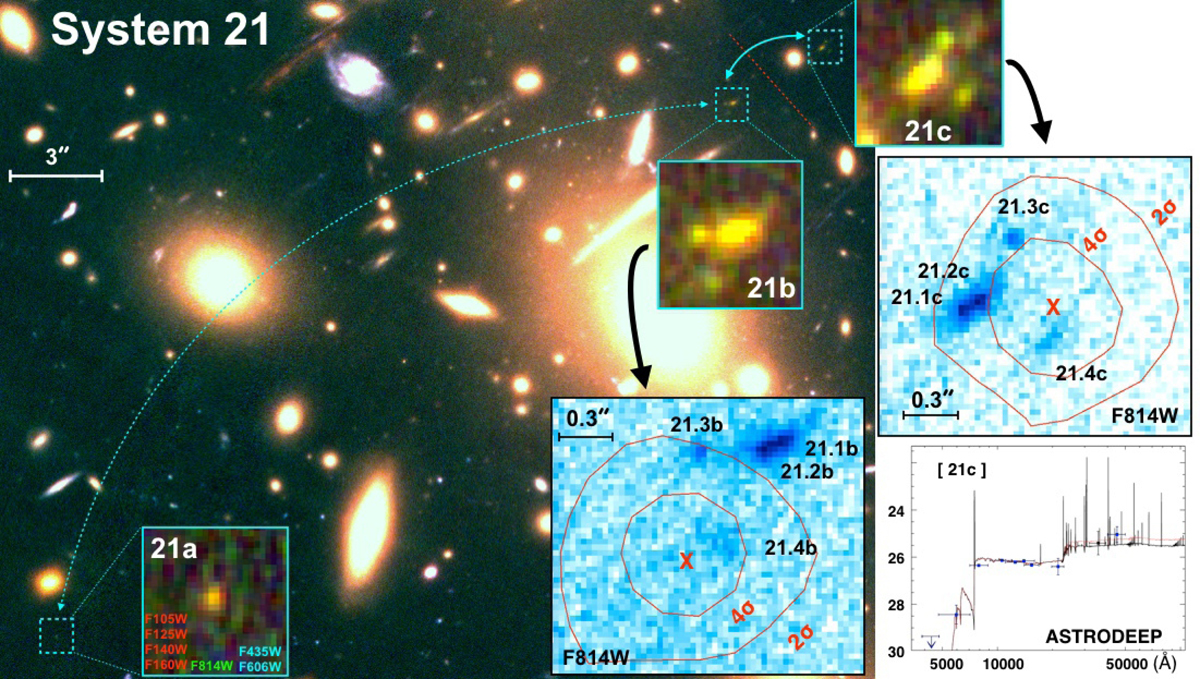
Three images (a,b,c) of source 21 are shown over the color image of the cluster. The insets show the deep RGB composite (F105W + F125W + F140W + F160W, F814W, F435W + F606W) of the multiple images. Image 21a is currently not covered by spectroscopy, however, we rely on the fact it is the only source with photometric redshift (zphot = 5.36), which is consistent with the spectroscopic one (z = 5.109) within an area of 10″ × 10″ from the predicted position provided by the lens model (1.2″ away from the source 21a (ID(ASTRODEEP) = 678). On the right, the F814W images (negative blue) with superimposed Lyα contours (red) at 2 and 4σ are shown with the SED-fitting performed with ASTRODEEP photometry. The peak of the Lyα emission is nearly located on top of clump 21.4b and 21.4c.
Current usage metrics show cumulative count of Article Views (full-text article views including HTML views, PDF and ePub downloads, according to the available data) and Abstracts Views on Vision4Press platform.
Data correspond to usage on the plateform after 2015. The current usage metrics is available 48-96 hours after online publication and is updated daily on week days.
Initial download of the metrics may take a while.