Fig. 2.
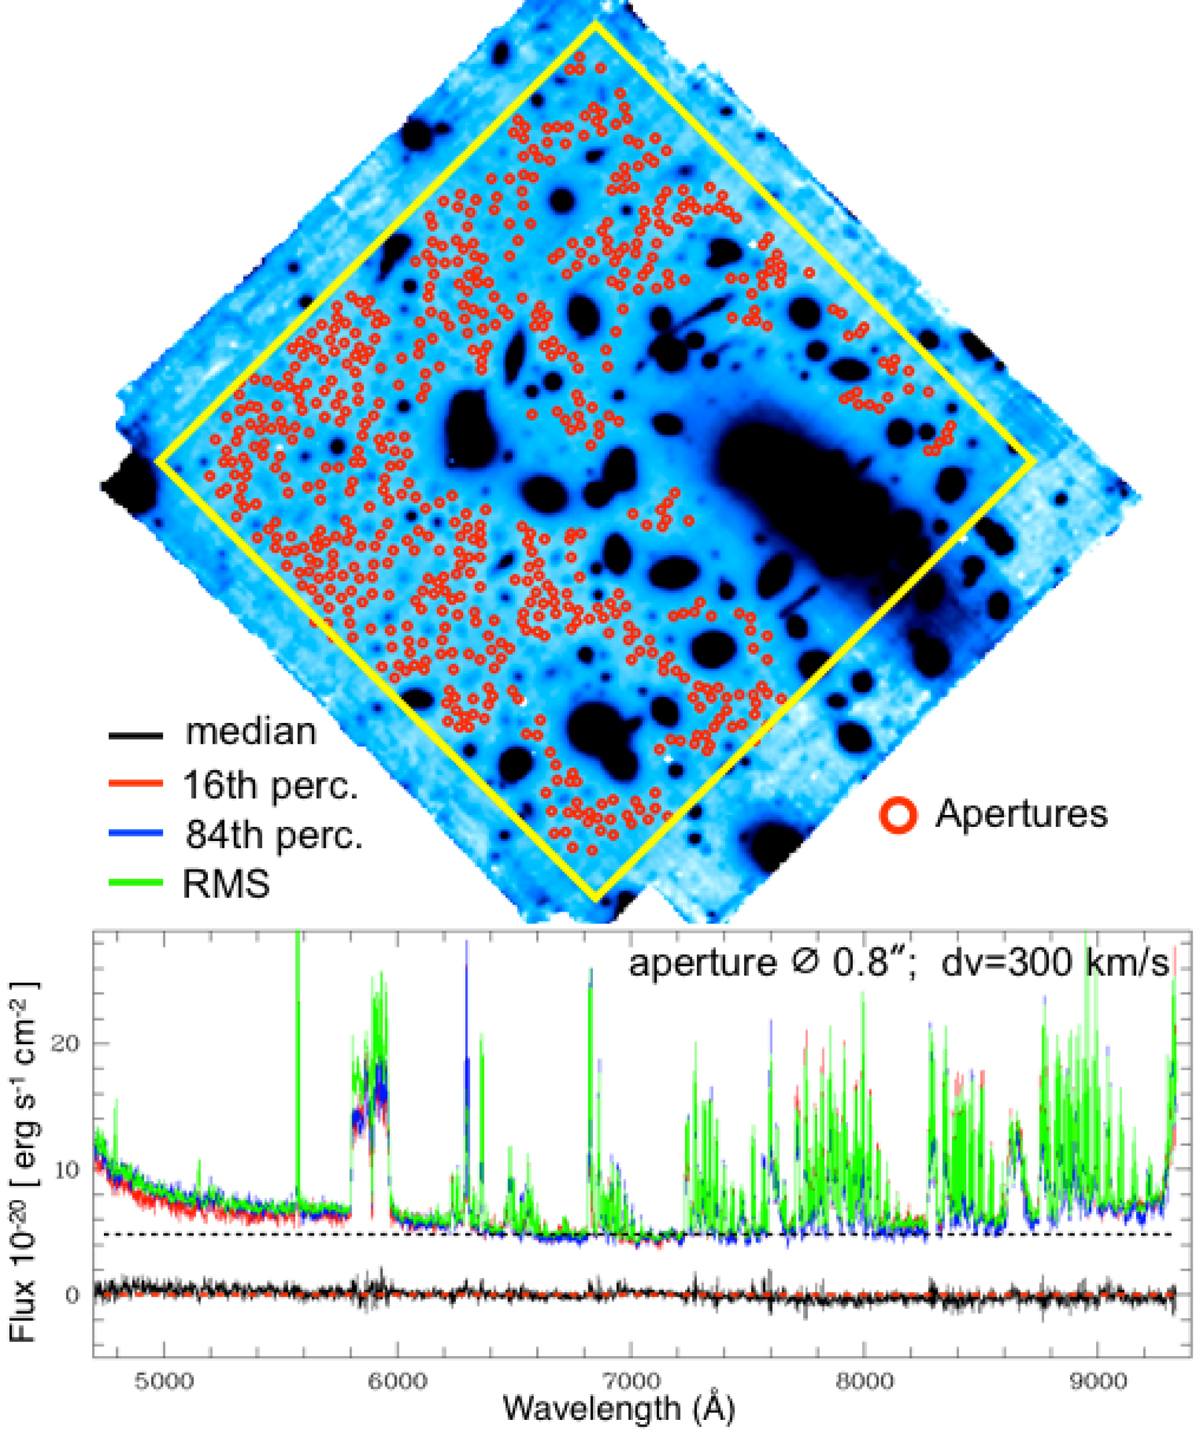
Top panel: white-light image of the MDLF is shown together with the 600 non-overlapping apertures placed in empty zones not intercepting visible objects in the image. The corresponding median value calculated at each wavelength and consistent with the zero level (black line), 16th−84th percentiles (red and blue lines), and the rms (green line) are reported below the white image. Apertures have a diameter of ![]() and the statistics is computed on each aperture by collapsing slices within dv = 300 km s−1. The pattern of the sky emission lines is evident. The increased noise in the range of 5800 < λ < 6000 Å is due to the emission of the laser used for ground layer AO.
and the statistics is computed on each aperture by collapsing slices within dv = 300 km s−1. The pattern of the sky emission lines is evident. The increased noise in the range of 5800 < λ < 6000 Å is due to the emission of the laser used for ground layer AO.
Current usage metrics show cumulative count of Article Views (full-text article views including HTML views, PDF and ePub downloads, according to the available data) and Abstracts Views on Vision4Press platform.
Data correspond to usage on the plateform after 2015. The current usage metrics is available 48-96 hours after online publication and is updated daily on week days.
Initial download of the metrics may take a while.