Fig. A.1.
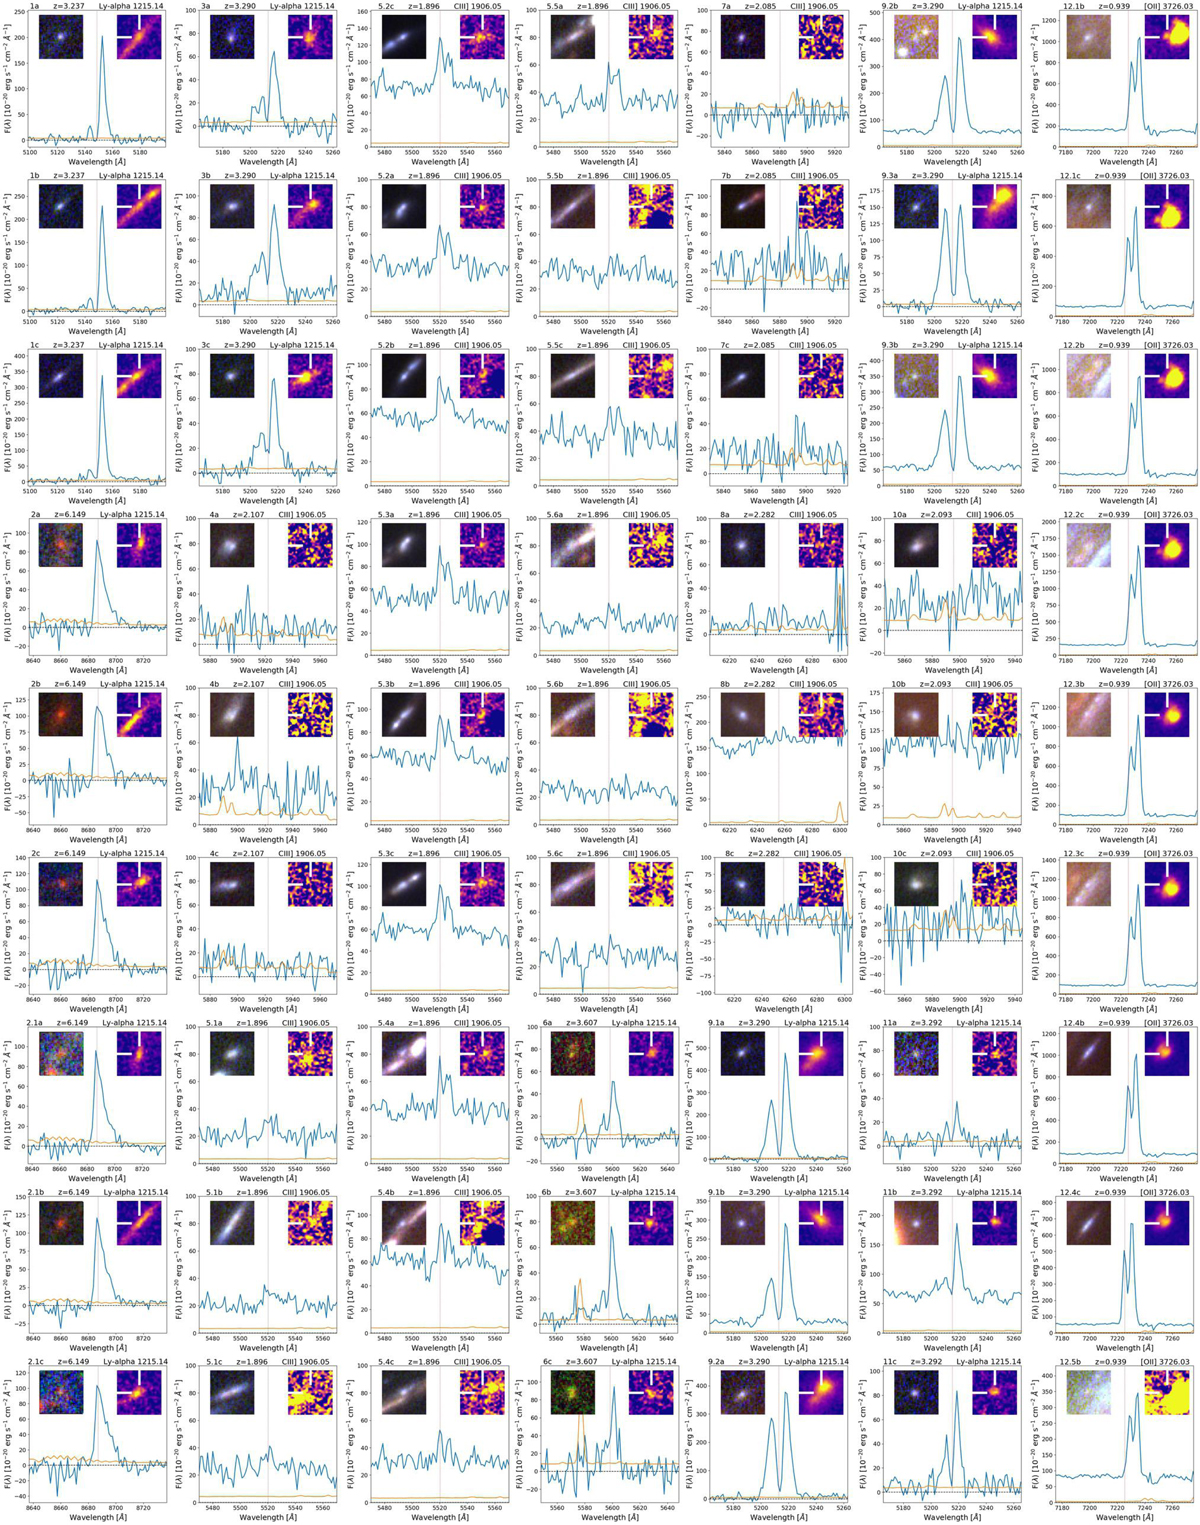
One-dimensional MUSE spectrum (blue) for the 182 multiple images used to build the lens model. Spectra are centered over the two most relevant atomic transitions: Lyα or C III]λλ1907, 1909, depending on redshift. The orange line is the error spectrum, and the red vertical line at the center of each cutout marks the wavelength of Lyα (or C III]λ1907) at the given redshift. The spectra have been extracted from circular apertures with ![]() diameter. Each thumbnail reports in the top, from left to right, the ID, redshift and the line transition. In each cutout, the inset on the top-left shows the HST RGB image corresponding to red = F814W, green = F606W, blue = F435W bands if z < 5.2, or red = F105W, green = F814W, blue = F606W bands if z > 5.2. The inset on the top-right is the continuum subtracted MUSE image of the same object, collapsed along the wavelength direction over 10(20) Å for C III (Lyα) line.
diameter. Each thumbnail reports in the top, from left to right, the ID, redshift and the line transition. In each cutout, the inset on the top-left shows the HST RGB image corresponding to red = F814W, green = F606W, blue = F435W bands if z < 5.2, or red = F105W, green = F814W, blue = F606W bands if z > 5.2. The inset on the top-right is the continuum subtracted MUSE image of the same object, collapsed along the wavelength direction over 10(20) Å for C III (Lyα) line.
Current usage metrics show cumulative count of Article Views (full-text article views including HTML views, PDF and ePub downloads, according to the available data) and Abstracts Views on Vision4Press platform.
Data correspond to usage on the plateform after 2015. The current usage metrics is available 48-96 hours after online publication and is updated daily on week days.
Initial download of the metrics may take a while.