Fig. 14.
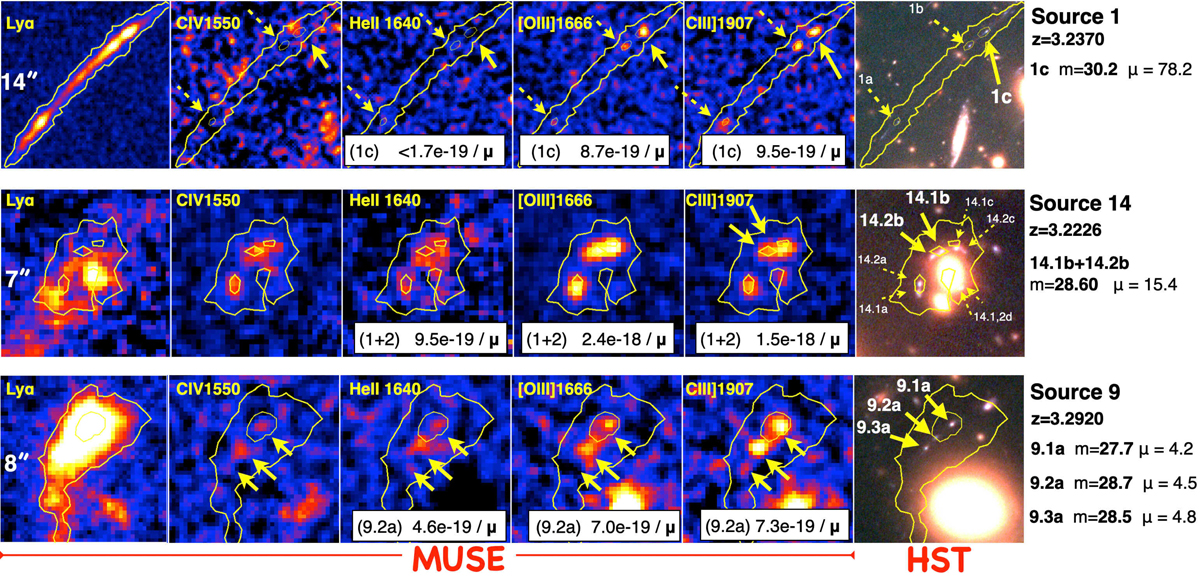
Three examples for which high-ionization emission lines are detected individually. From left to right: most relevant atomic transitions (labeled on each panel). Yellow contours outline Lyα (C IV) in the top and bottom (middle) rows at 2- ad 10-σ levels. The MUSE continuum-subtracted narrow-band images (dv = 300 km s−1) have been smoothed with a 2 × 2 boxcar filter along the spatial dimension. On the right, the color HST image (red = F105W, green = F814W, blue = F606W) with arrows showing relevant sources. Solid arrows refer to individual sources, while the dashed ones to the associated multiple images, when present. Measured line fluxes are also reported for He II, [O III] and C III; the intrinsic values are obtained using the μ values quoted on the right, together with redshifts and de-lensed magnitudes. Magnifications for sources 1 and 14 are also reported in Table E.1. We note the case of source 9 (bottom) where high-ionization lines emerge differently from the three individual clumps (9.1a, 9.2a, 9.3a). The Lyα emission in the leftmost panels show a typical arc−like shape (top, Vanzella et al. 2017a), a deficit of Lyα emission if compared to carbon emission (middle, see one-dimensional spectrum in Appendix C and Vanzella et al. 2017b), and a Lyα nebula (bottom, Vanzella et al. 2017c).
Current usage metrics show cumulative count of Article Views (full-text article views including HTML views, PDF and ePub downloads, according to the available data) and Abstracts Views on Vision4Press platform.
Data correspond to usage on the plateform after 2015. The current usage metrics is available 48-96 hours after online publication and is updated daily on week days.
Initial download of the metrics may take a while.