Fig. 13.
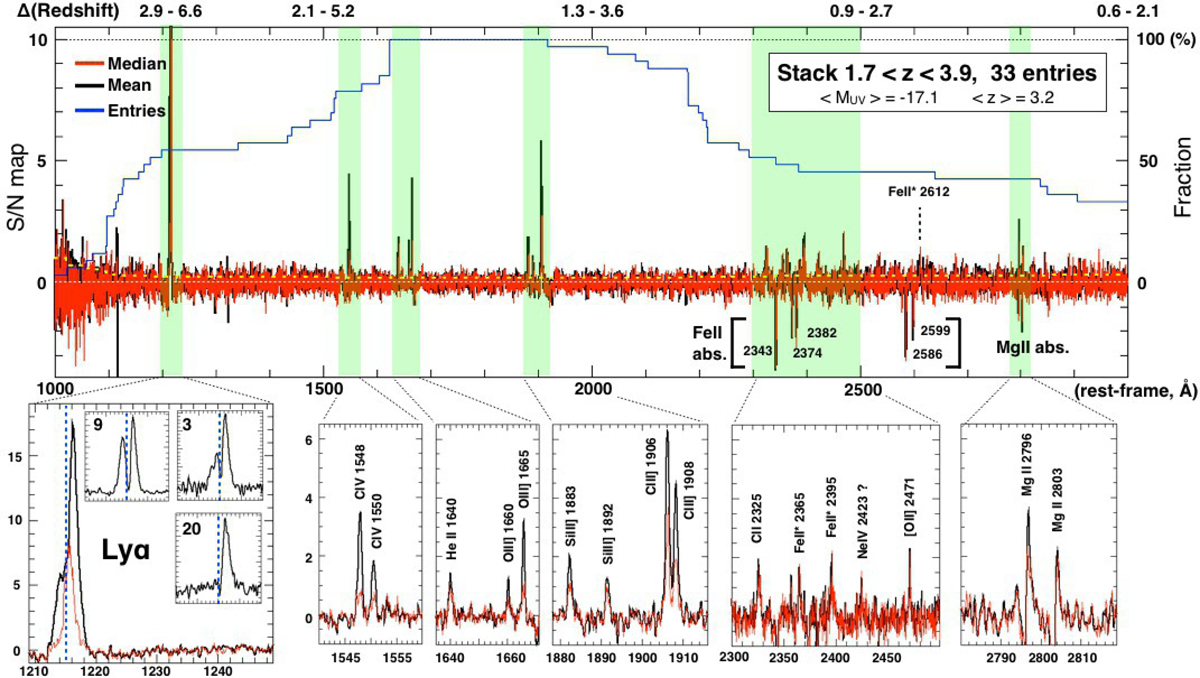
Mean (median) S/N stacked detection map of sources lying in the redshift range of 1.7 < z < 3.9 is shown in black (red) on the top panel. The number of entries included in the stack is shown in blue and the fraction reported in the right Y-axis, where 100% corresponds to 33 entries. On the top axis, the corresponding redshift interval probed by MUSE is indicated for the rest-frame wavelengths reported on the X-axis. The yellow dashed line represent the 1-sigma error of the stack, increasing at the edges of the wavelength range. The green transparent stripes indicate the positions of the most relevant groups of high-ionization lines, whose zoomed versions are shown in the bottom panels. Bottom leftmost panel: the zoomed Lyα line is shown and is a result of a variety of different line profiles; as an example, three different cases are reported in the insets of the same panel, extracted from sources 9, 3, and 20 shown in relative flux units, with the systemic redshift indicated with the vertical blue dashed lines.
Current usage metrics show cumulative count of Article Views (full-text article views including HTML views, PDF and ePub downloads, according to the available data) and Abstracts Views on Vision4Press platform.
Data correspond to usage on the plateform after 2015. The current usage metrics is available 48-96 hours after online publication and is updated daily on week days.
Initial download of the metrics may take a while.