Fig. 12.
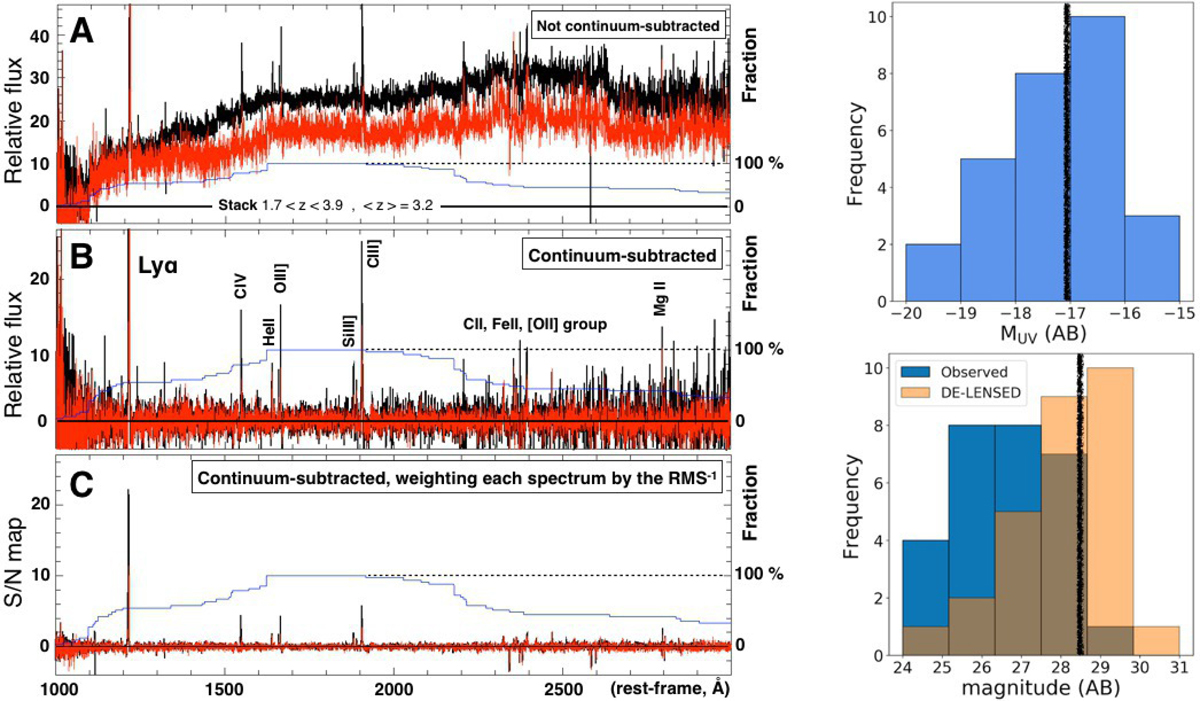
Left panels: mean(median) stacked spectrum of 33 sources at redshift 1.7 < z < 3.9 shown in black(red). Panel A: raw stacking of sources without any continuum subtraction. The contamination from the foreground galaxy cluster is evident. Middle panel B: the spectra are stacked after subtracting the continuum. Panel C: result of weighting by the inverse of the noise the continuum subtracted spectra (see Fig. 13 for a zoomed version), which we use as an emission line detection map. The blue curve in panels A–C shows the percentage of input spectra (out of 33) entering in the stacking. Right panels: top-right histogram shows the delensed absolute magnitudes of the sources in the stack; bottom-right panel: observed (blue) and intrinsic (orange) magnitudes. The vertical black stripes indicate the median values of the distributions.
Current usage metrics show cumulative count of Article Views (full-text article views including HTML views, PDF and ePub downloads, according to the available data) and Abstracts Views on Vision4Press platform.
Data correspond to usage on the plateform after 2015. The current usage metrics is available 48-96 hours after online publication and is updated daily on week days.
Initial download of the metrics may take a while.