Fig. 1.
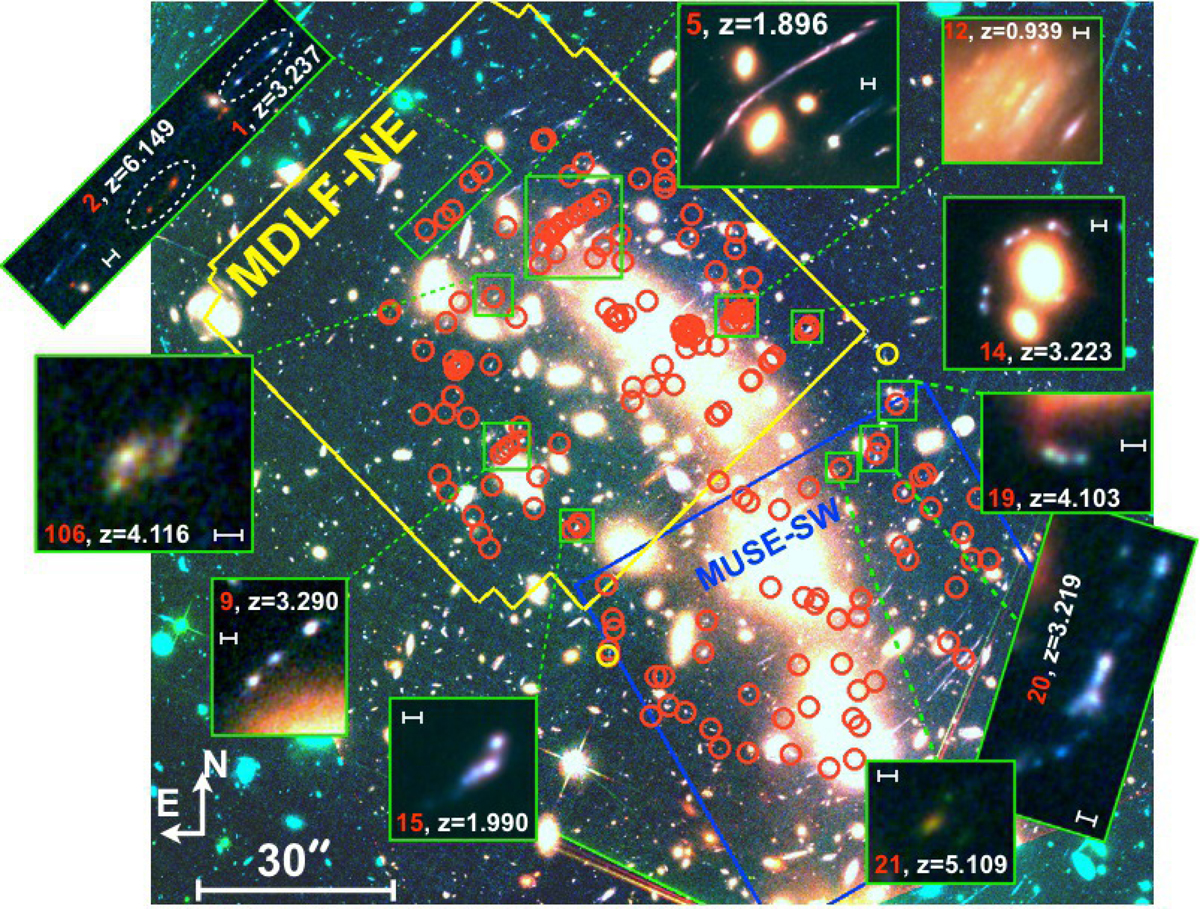
Color image of the HFF galaxy cluster MACS J0416 shown in the main panel (red, green, and blue as F105W, F814W, and F606W, respectively). The MDLF centered in the north-east part of the cluster is outlined by the yellow contour (17.1 h integration time), while the blue contour shows the observation in the south-west (11 h integration, PI Bauer, 094.A-0525(A)). The red circles mark the positions of the 182 multiple images used to constrain the lens model (Bergamini et al. 2021). The insets show zoomed examples of strongly lensed objects with detected clumps in the redshift range of 1.5 < z < 6.5 (discussed in detail in Sect. 4). In each inset, the catalog ID (red number) and redshift are indicated, while the segment marks the ![]() scale. Yellow circles mark two images not covered by MUSE, which are however included in the multiple images sample due to their mirroring lensing properties.
scale. Yellow circles mark two images not covered by MUSE, which are however included in the multiple images sample due to their mirroring lensing properties.
Current usage metrics show cumulative count of Article Views (full-text article views including HTML views, PDF and ePub downloads, according to the available data) and Abstracts Views on Vision4Press platform.
Data correspond to usage on the plateform after 2015. The current usage metrics is available 48-96 hours after online publication and is updated daily on week days.
Initial download of the metrics may take a while.