Fig. 8
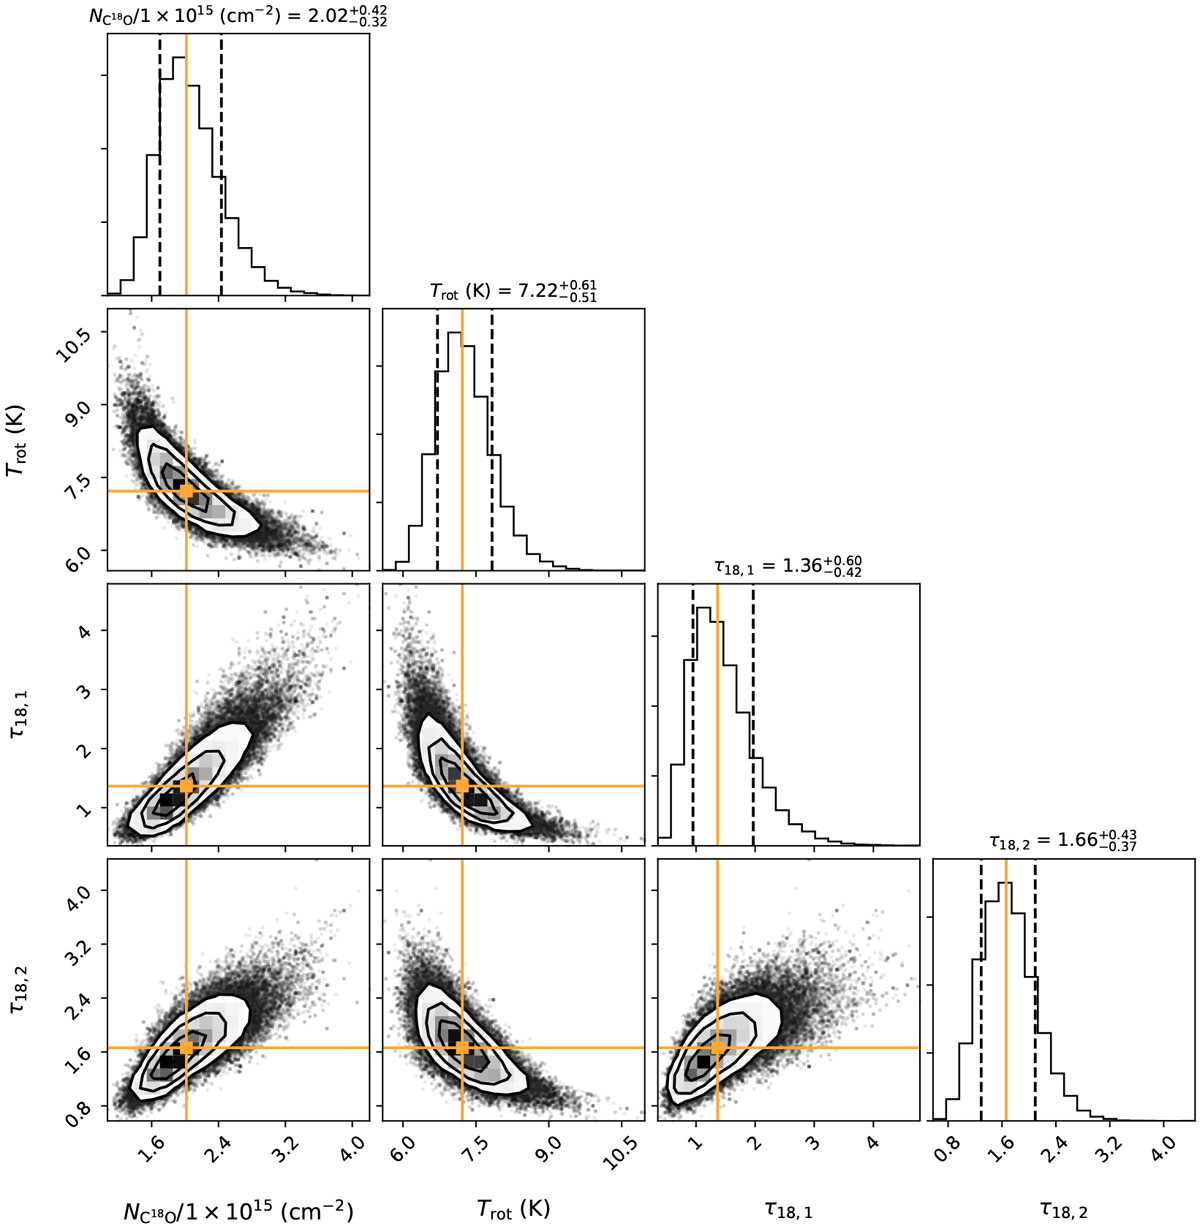
Posterior probability distributions of C18O column density, ![]() , rotational temperature, Trot, the C18O (1–0) opacity, τ18,1, and the C18O (2–1) opacity, τ18,2, toward the dense core, Bolo12, with the maximum posterior possibility point in the parameterspace shown in orange lines and points. Contours denote the 0.5, 1.0, 1.5, and 2.0σ
confidence intervals.
, rotational temperature, Trot, the C18O (1–0) opacity, τ18,1, and the C18O (2–1) opacity, τ18,2, toward the dense core, Bolo12, with the maximum posterior possibility point in the parameterspace shown in orange lines and points. Contours denote the 0.5, 1.0, 1.5, and 2.0σ
confidence intervals.
Current usage metrics show cumulative count of Article Views (full-text article views including HTML views, PDF and ePub downloads, according to the available data) and Abstracts Views on Vision4Press platform.
Data correspond to usage on the plateform after 2015. The current usage metrics is available 48-96 hours after online publication and is updated daily on week days.
Initial download of the metrics may take a while.