Fig. 7
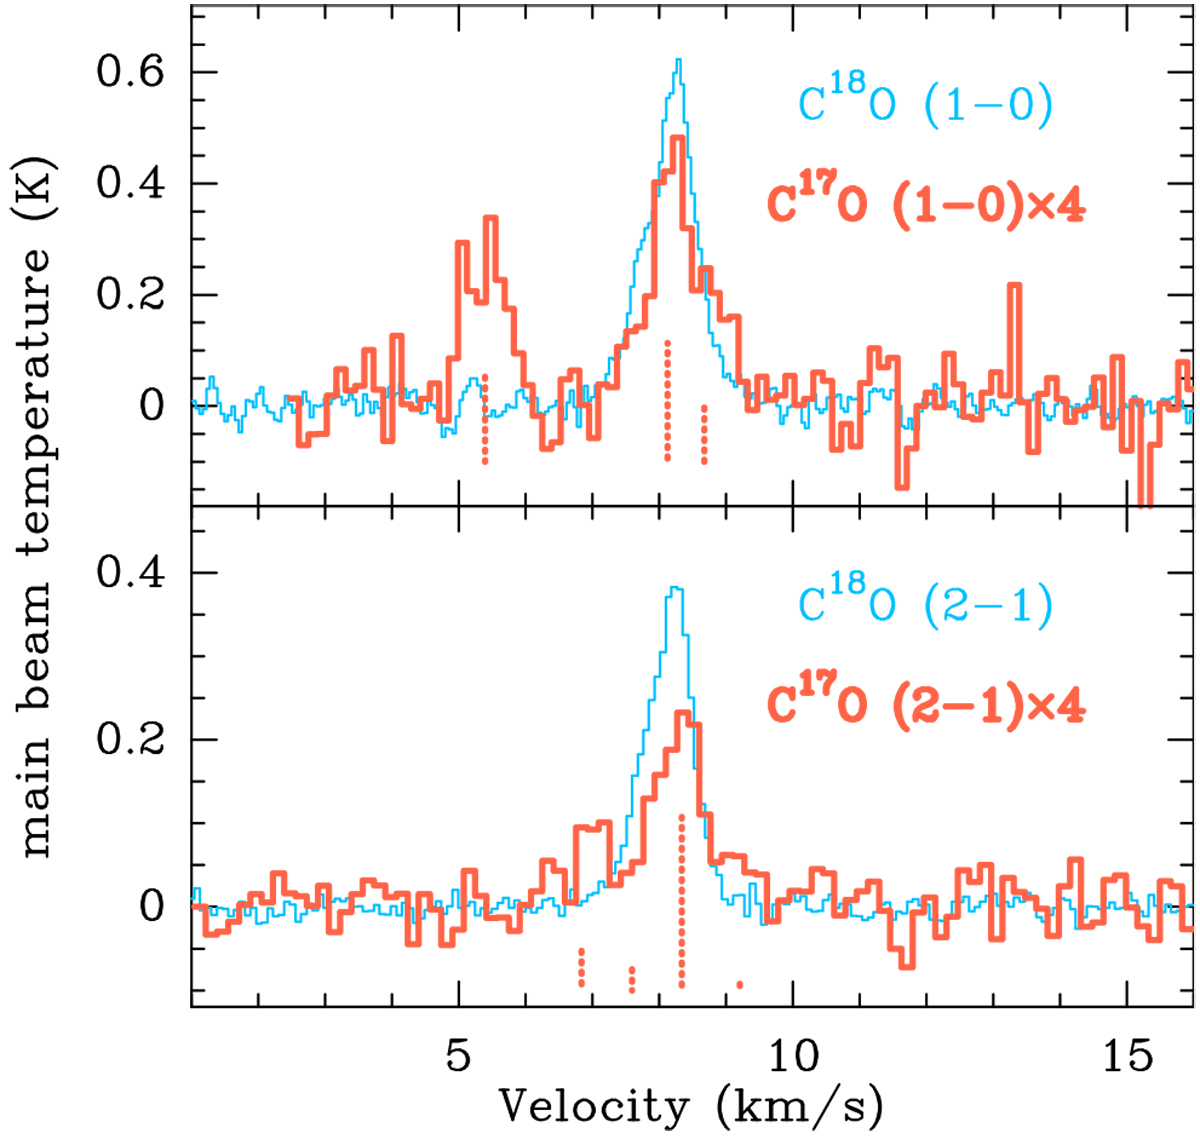
C18O (1–0), C17O (1–0), C18O (2–1), and C17O (2–1) spectra averaged over the low-brightness-temperature mask (details are discussed in Sect. 3.4). The two C17O spectra have been scaled by a factor of 4. The hyperfine structure components of both C17O transitions are indicated by vertical dashed lines.
Current usage metrics show cumulative count of Article Views (full-text article views including HTML views, PDF and ePub downloads, according to the available data) and Abstracts Views on Vision4Press platform.
Data correspond to usage on the plateform after 2015. The current usage metrics is available 48-96 hours after online publication and is updated daily on week days.
Initial download of the metrics may take a while.