Fig. 5
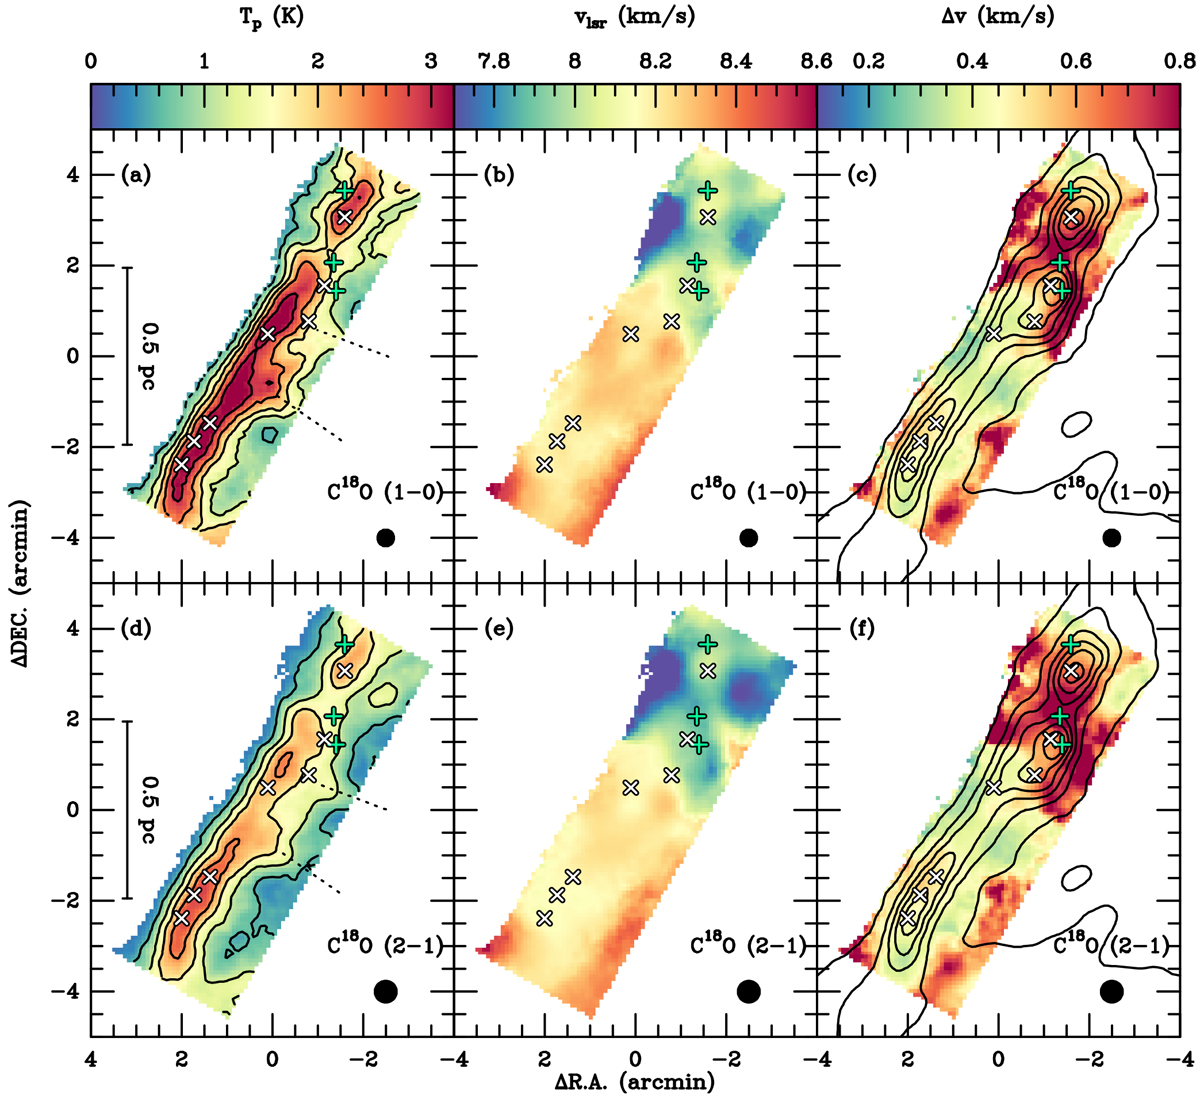
Maps of peak intensities (a), LSR velocities (b), and line widths (c) derived from single-component Gaussian fits to our C18O (1–0) data. Panels d–f are similar to panels a–c, but for C18O (2–1). In panels a and d, the contours represent the peak intensities which start at 0.6 K and increase by 0.6 K, while in c and f the contours represent the H2 column densities that start at 1 × 1021 cm−2 and increase by 3 × 1021 cm−2. In panels a and d, the dotted lines indicate possible substructures. The beam size is shown in the lower right corner of each panel. In all panels, the (0, 0) offset corresponds to αJ2000 = 18h28m50.s4, δJ2000 = 00°49′58.′′72, the three green pluses indicate the positions of the three embedded YSOs, emb10, emb16, and Ser-emb 28 (Enoch et al. 2009), and the white crosses mark the positions of the seven dust cores (Enoch et al. 2007).
Current usage metrics show cumulative count of Article Views (full-text article views including HTML views, PDF and ePub downloads, according to the available data) and Abstracts Views on Vision4Press platform.
Data correspond to usage on the plateform after 2015. The current usage metrics is available 48-96 hours after online publication and is updated daily on week days.
Initial download of the metrics may take a while.