Fig. B.1
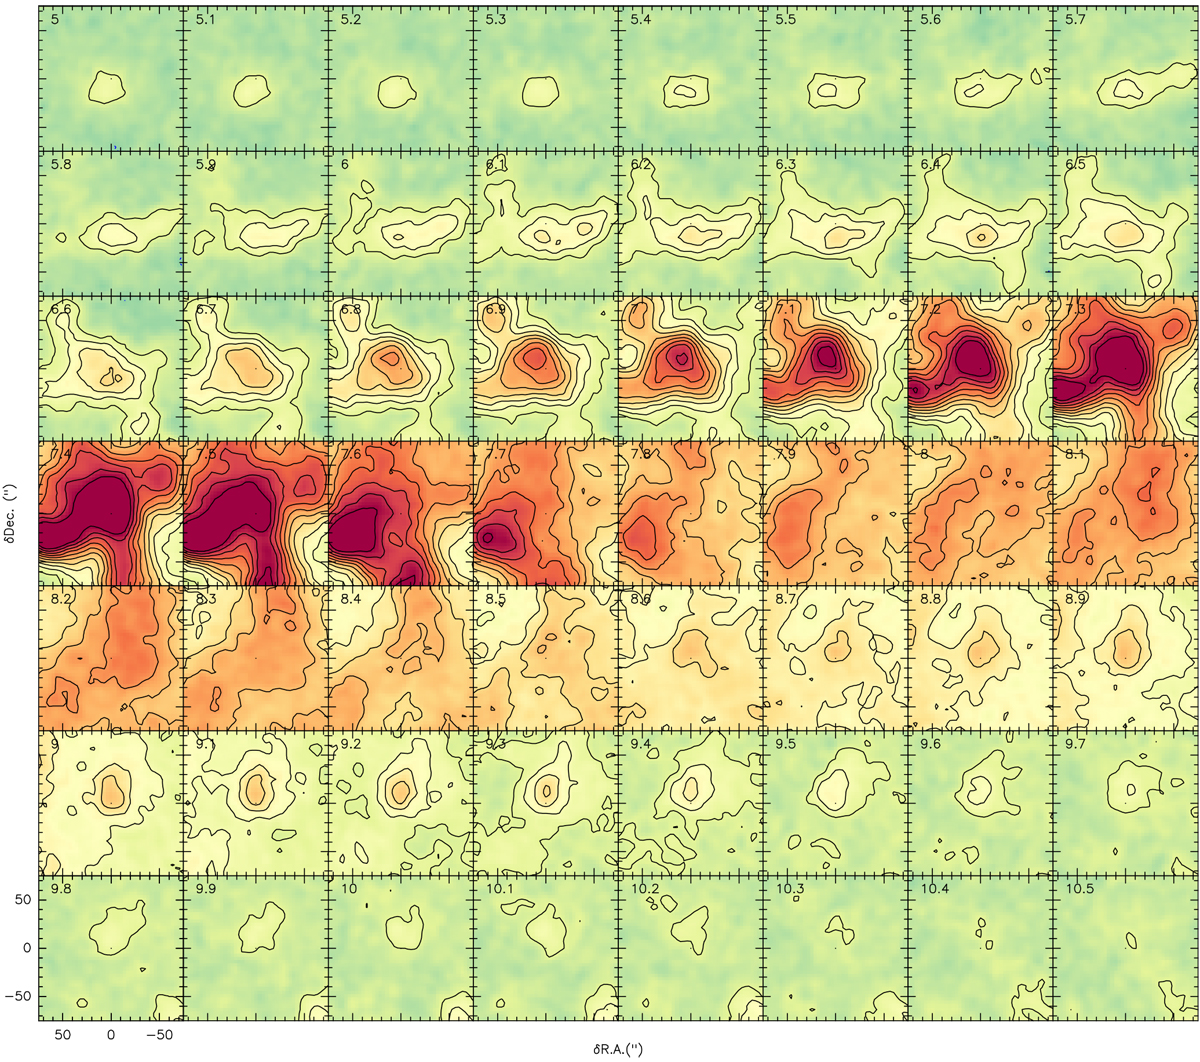
13CO (2–1) channel map of the molecular outflow driven by Ser-emb 28. The LSR velocity is indicated in the top left corner of each panel. The contours start at 0.2 K (3σ), and increase by factors of 2. The offset (0,0) corresponds to the position of Ser-emb 28. The displayed area is the same as Fig. 4b.
Current usage metrics show cumulative count of Article Views (full-text article views including HTML views, PDF and ePub downloads, according to the available data) and Abstracts Views on Vision4Press platform.
Data correspond to usage on the plateform after 2015. The current usage metrics is available 48-96 hours after online publication and is updated daily on week days.
Initial download of the metrics may take a while.