Fig. A.1
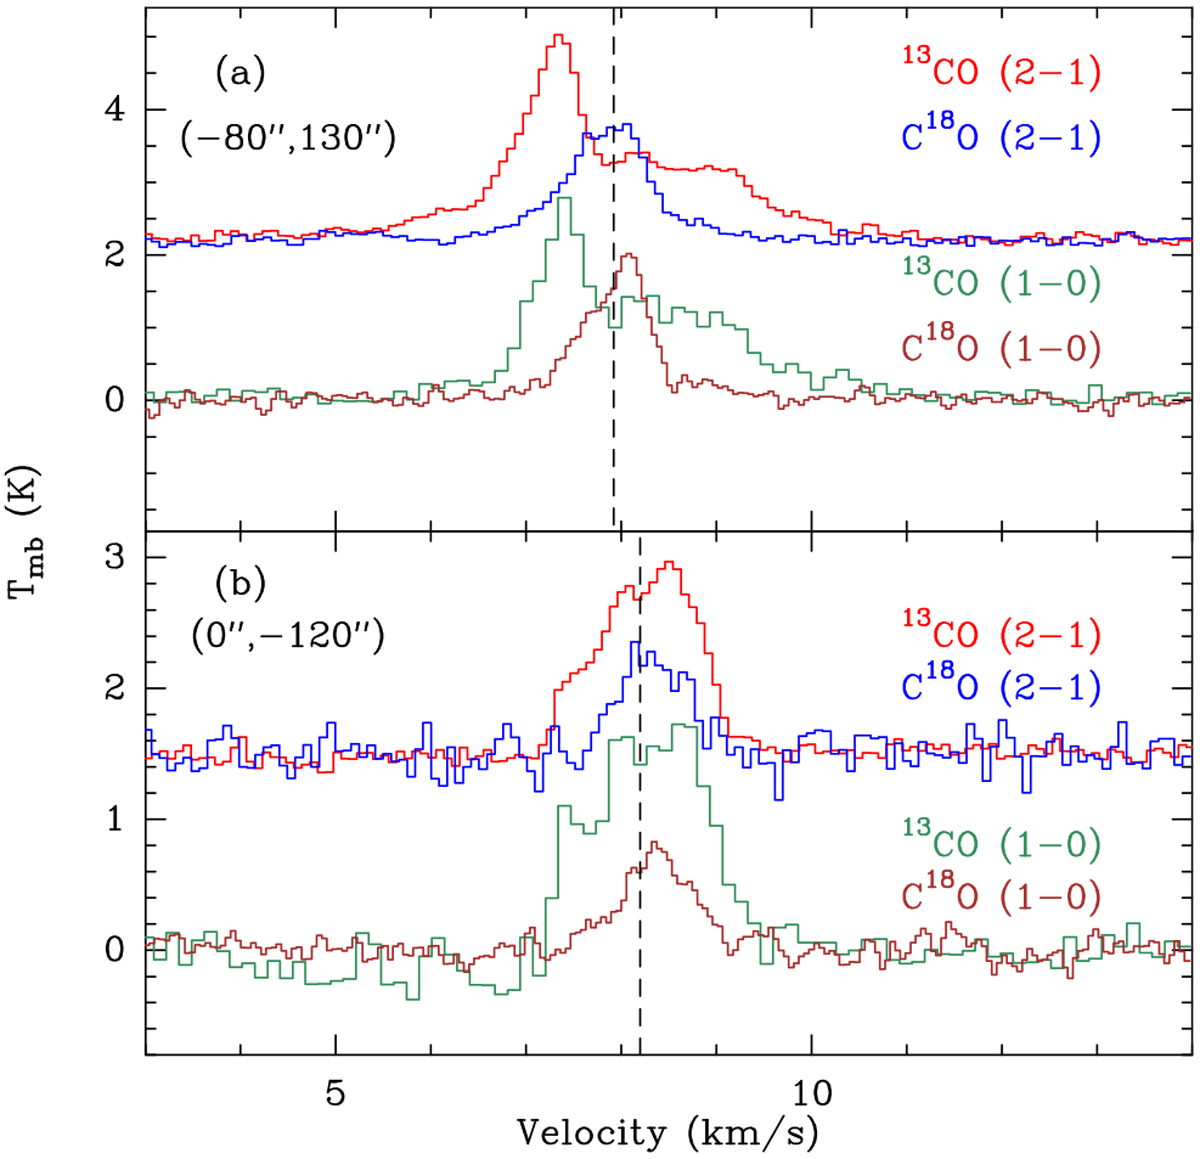
Detailed view on the spectra toward two selected positions, the offsets of which are indicated in the upper left corner. For the origin of the coordinate system, see the caption to Fig. 2. In each panel, the dashed line marks the velocity of the absorption dip seen in the 13CO spectra, highlighting that the velocity of the dip varies with position.
Current usage metrics show cumulative count of Article Views (full-text article views including HTML views, PDF and ePub downloads, according to the available data) and Abstracts Views on Vision4Press platform.
Data correspond to usage on the plateform after 2015. The current usage metrics is available 48-96 hours after online publication and is updated daily on week days.
Initial download of the metrics may take a while.