Fig. 2
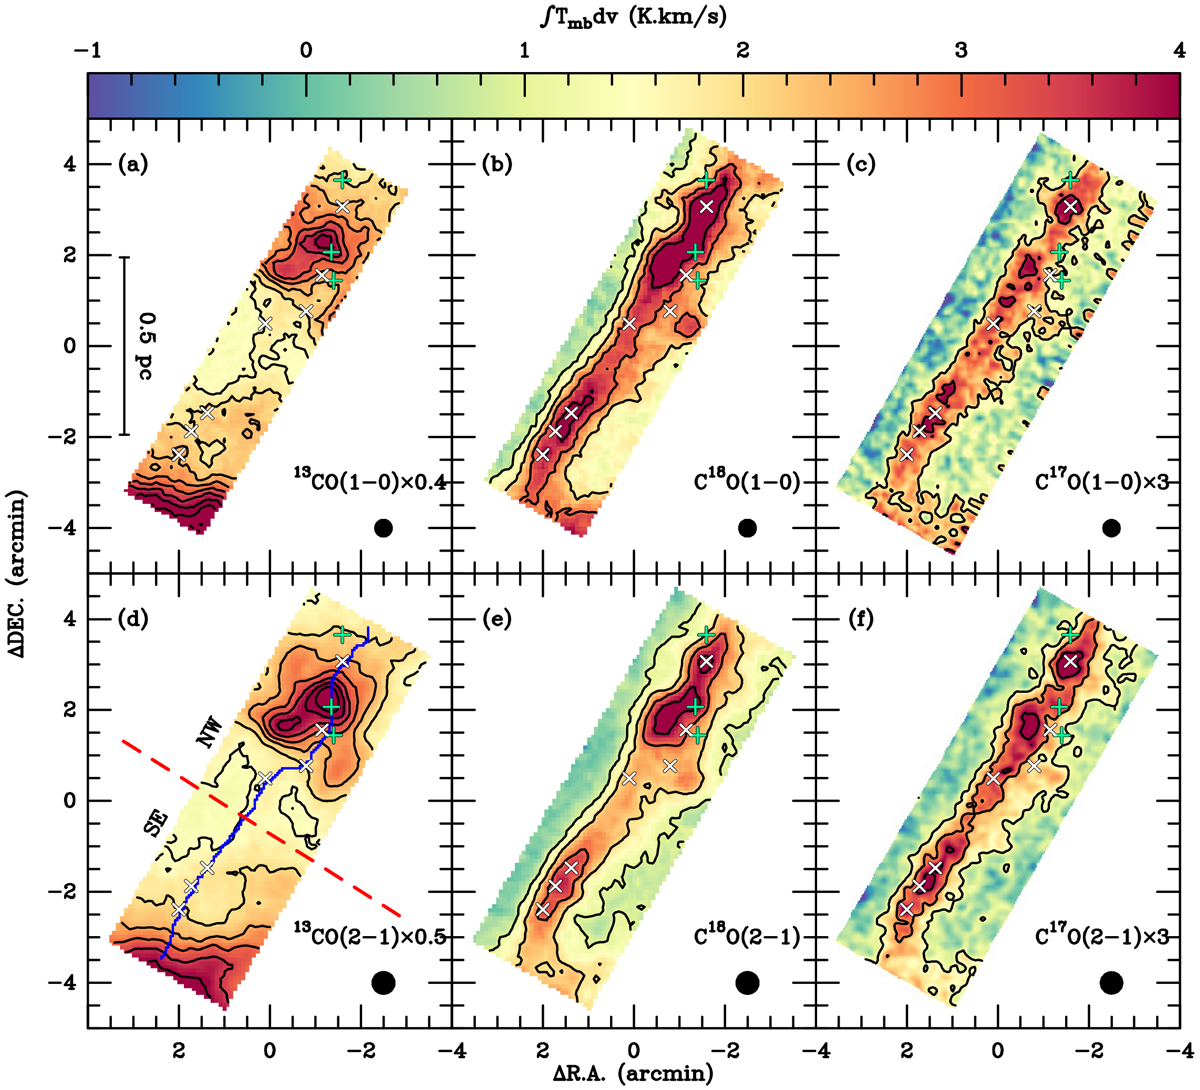
Integrated intensity maps of 13CO (1–0) (a), C18O (1–0) (b), C17O (1–0) (c), 13CO (2–1) (d), C18O (2–1) (e), and C17O (2–1) (f). Their integrated velocity ranges are [6.5, 10] km s−1 for 13CO (1–0), C18O (1–0), 13CO (2–1), and C18O (2–1), [7.5, 9] km s−1 for C17O(1–0), and [6, 10] km s−1 for C17O (2–1). The contours start at 0.4 K km s−1 with a step of 0.4 K km s−1 for 13CO (1–0), C18O (1–0), 13CO (2–1), and C18O (2–1). For the two C17O maps, the contours start at 3σ with a step of 3σ, where 1σ = 0.08 K km s−1 for C17O (1–0) and 1σ = 0.06 K km s−1 for C17O (2–1). The color bar represents the C18O (1–0) and C18O (2–1) integrated intensities in units of K km s−1. The 13CO (1–0), 13CO (2–1), C17O (1–0), and C17O (2–1) maps have been scaled by 0.4, 0.5, 3, and 3 to match the color bar. Panel d: the red dashed line is used to divide the Serpens filament into two parts, NW and SE, and the blue line represents the crest of the Serpens filament extracted in the corresponding H2 column density map (Gong et al. 2018). In all panels, the (0, 0) offset corresponds to αJ2000 = 18h28m50.s4, δJ2000 = 00°49′58.′′72, the three green pluses indicate the positions of the three embedded YSOs, emb10, emb16, and Ser-emb 28 (see Enoch et al. 2009, and Fig. 1), and the white crosses mark the positions of the seven dust cores (see Enoch et al. 2007, and Fig. 1).
Current usage metrics show cumulative count of Article Views (full-text article views including HTML views, PDF and ePub downloads, according to the available data) and Abstracts Views on Vision4Press platform.
Data correspond to usage on the plateform after 2015. The current usage metrics is available 48-96 hours after online publication and is updated daily on week days.
Initial download of the metrics may take a while.