Fig. 18
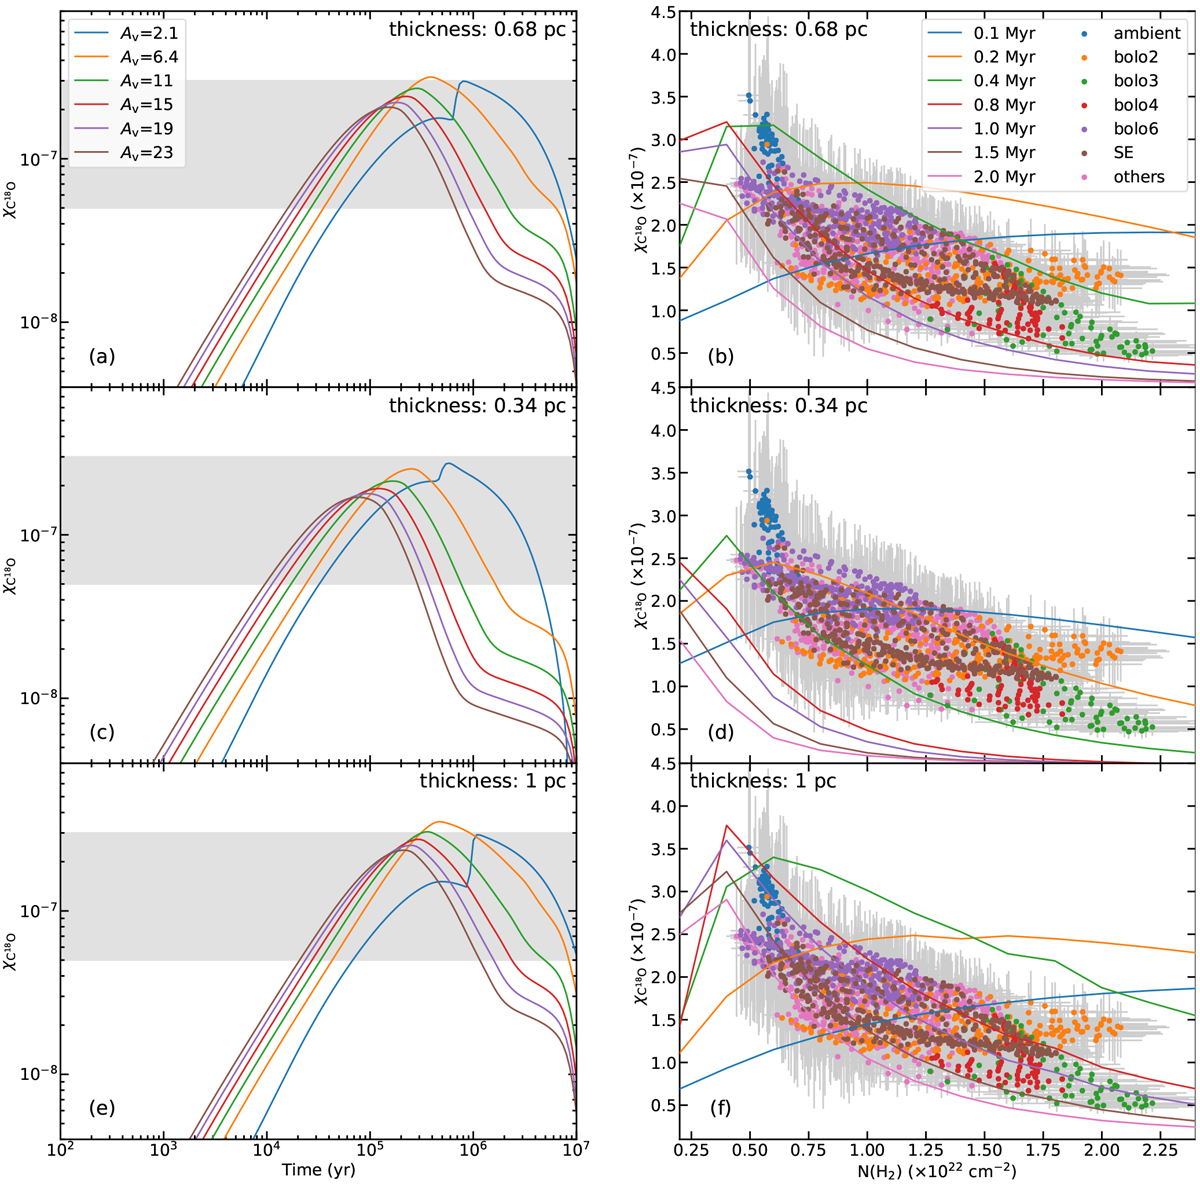
(a) C18O fractional abundances, ![]() , as a function of time, as calculated with different H2
column densities and an assumed thickness of 0.68 pc. The shaded region corresponds to the observed C18O fractional abundance range. (b) Similar to Fig. 13, but overlaid with the isochronic lines which are based on the results in a. The markers represent the observed relationship between C18O fractional abundance and H2
column density with different regions labeled in different colors. c and e are similar to a, but for an assumed thickness of 0.34 pc and 1 pc, respectively. Panels d and f are similar to panel b, but for an assumed thickness of 0.34 pc and 1 pc, respectively.
, as a function of time, as calculated with different H2
column densities and an assumed thickness of 0.68 pc. The shaded region corresponds to the observed C18O fractional abundance range. (b) Similar to Fig. 13, but overlaid with the isochronic lines which are based on the results in a. The markers represent the observed relationship between C18O fractional abundance and H2
column density with different regions labeled in different colors. c and e are similar to a, but for an assumed thickness of 0.34 pc and 1 pc, respectively. Panels d and f are similar to panel b, but for an assumed thickness of 0.34 pc and 1 pc, respectively.
Current usage metrics show cumulative count of Article Views (full-text article views including HTML views, PDF and ePub downloads, according to the available data) and Abstracts Views on Vision4Press platform.
Data correspond to usage on the plateform after 2015. The current usage metrics is available 48-96 hours after online publication and is updated daily on week days.
Initial download of the metrics may take a while.