Fig. 17
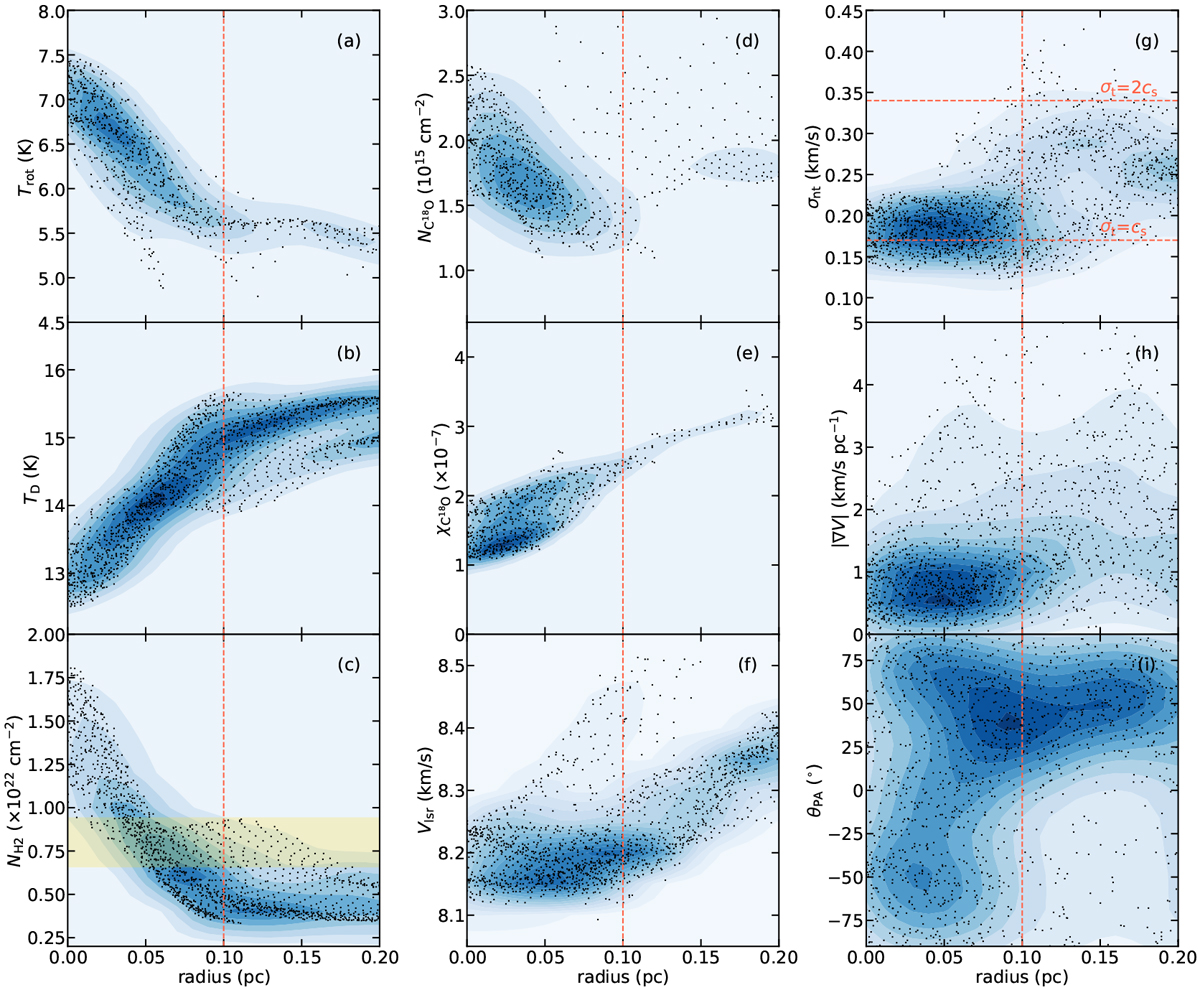
C18O rotational temperature (a), dust temperature (b), H2 column density (c), C18O column density (d), C18O fractional abundance (e), velocity centroid (f), nonthermal velocity dispersion (g), magnitude of velocity gradient (h), and position angle of velocity gradient (i) plotted as a function of their distance to the crest of SE. In c, the yellow shaded region marks the star formation threshold of Av = 7–10 mag (e.g., Johnstone et al. 2004; Lada et al. 2010; Heiderman et al. 2010; André et al. 2010; Könyves et al. 2015). In all panels, the radius of 0.1 pc is marked with a red dashed line, which indicates the transition discussed in Sect. 4.3. We note that the data points become incomplete at larger radial distances in panels a, d, e, and f due to the 3σ clipping mentioned in Sect. 3.4. In panel g, the two red horizontal dashed lines mark σt = cs and σt = 2cs where cs is the soundspeed at a kinetic temperature of 7 K.
Current usage metrics show cumulative count of Article Views (full-text article views including HTML views, PDF and ePub downloads, according to the available data) and Abstracts Views on Vision4Press platform.
Data correspond to usage on the plateform after 2015. The current usage metrics is available 48-96 hours after online publication and is updated daily on week days.
Initial download of the metrics may take a while.