Fig. 14
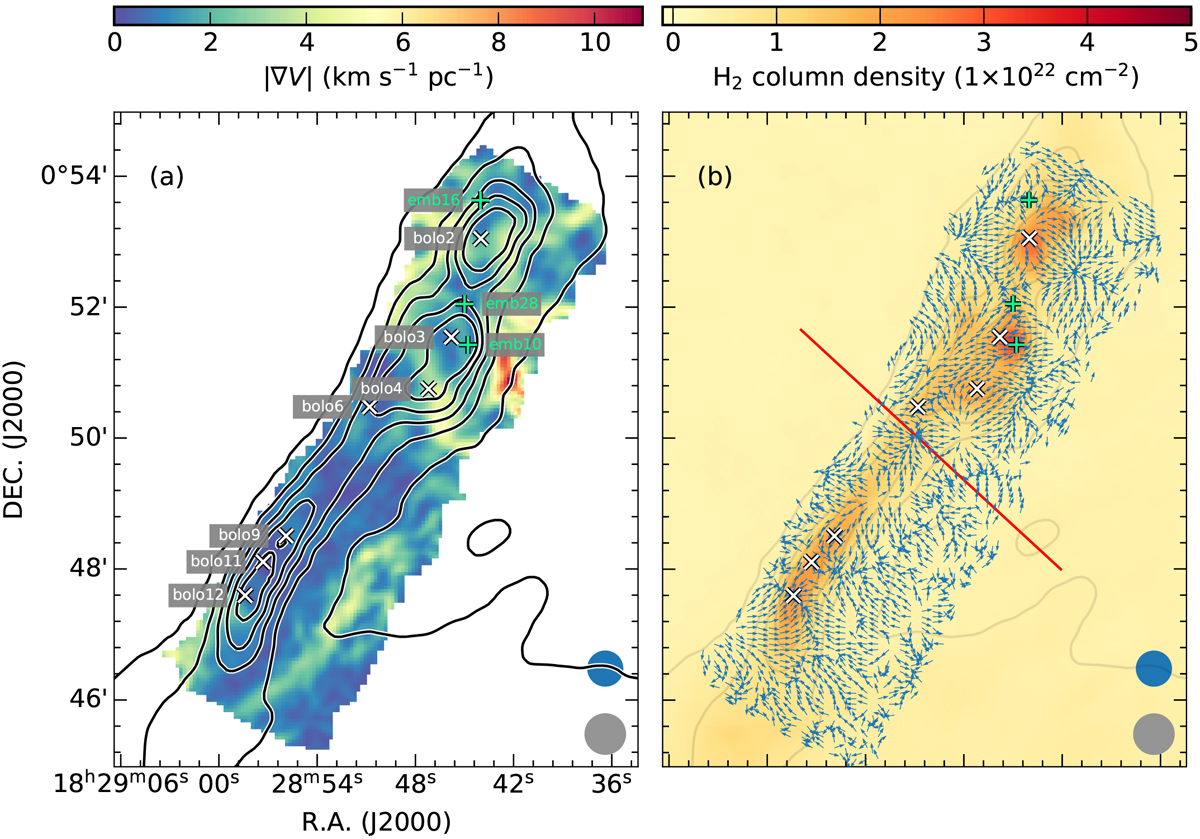
(a) Local velocity gradient magnitude map overlaid with the H2 column density contours. (b) Herschel H2 column density map overlaid with the normalized velocity vector maps. The arrows represent the estimated local velocity gradients which are rotated by 180° in order to better visualize the accretion directions in SE. The polarized angle of the Planck 353 GHz thermal dust emission has been rotated by 90° to trace the magnetic field direction which is indicated by the red line. In both panels, the contours correspond to H2 column densities from 1 × 1021 cm−2 to 1.6 × 1022 cm−2 with a step of 3 × 1021 cm−2, and the beam sizes for the H2 column density and velocity gradient maps are shown as the gray and blue circles in the lower right corner. The three green plusesgive the positions of the three embedded YSOs, emb10, emb16, and Ser-emb 28 (Enoch et al. 2009), and the white crosses mark the positions of the seven dust cores (Enoch et al. 2007).
Current usage metrics show cumulative count of Article Views (full-text article views including HTML views, PDF and ePub downloads, according to the available data) and Abstracts Views on Vision4Press platform.
Data correspond to usage on the plateform after 2015. The current usage metrics is available 48-96 hours after online publication and is updated daily on week days.
Initial download of the metrics may take a while.