Fig. 12
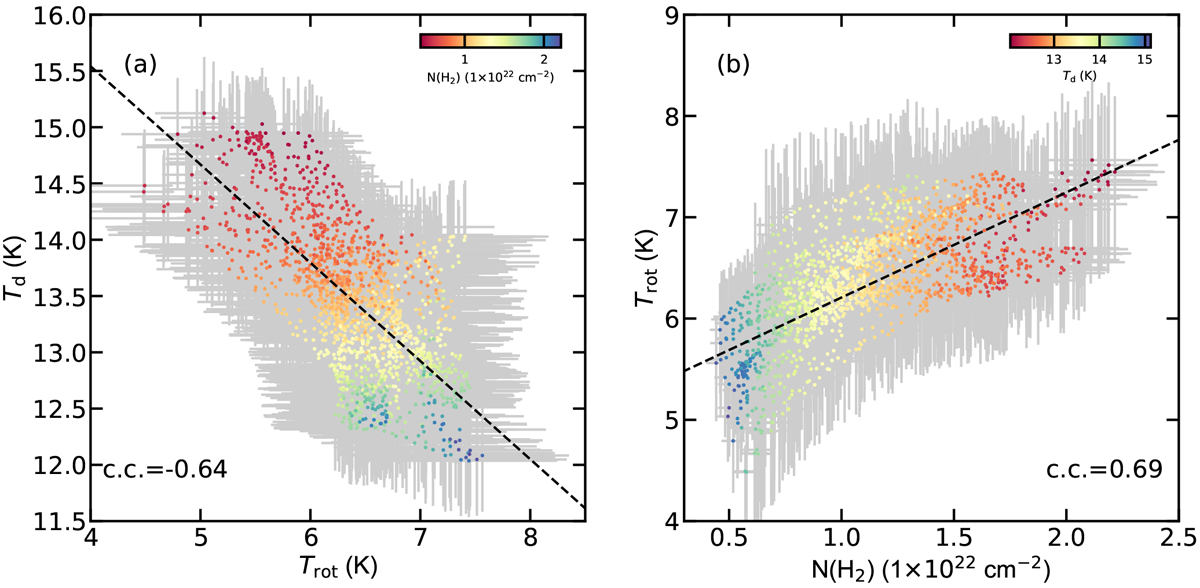
(a) Dust temperature as a function of the C18O rotational temperature. The gray error bars represent the measured uncertainties in the measured dust temperature and rotational temperature. The markers’ colors correspond to their H2 column densities indicated by the color bar. The Pearson correlation coefficient is shown in the lower left. (b) C18O rotational temperature as a function of the H2 column density. The gray error bars represent the measured uncertainties in the measured rotational temperature and H2 column density. The markers’ colors correspond to their dust temperatures indicated by the color bar. The Pearson correlation coefficient is shown in the lower right. In both panels, the black dashed line represents the linear fit to the observed trend.
Current usage metrics show cumulative count of Article Views (full-text article views including HTML views, PDF and ePub downloads, according to the available data) and Abstracts Views on Vision4Press platform.
Data correspond to usage on the plateform after 2015. The current usage metrics is available 48-96 hours after online publication and is updated daily on week days.
Initial download of the metrics may take a while.