Fig. 8.
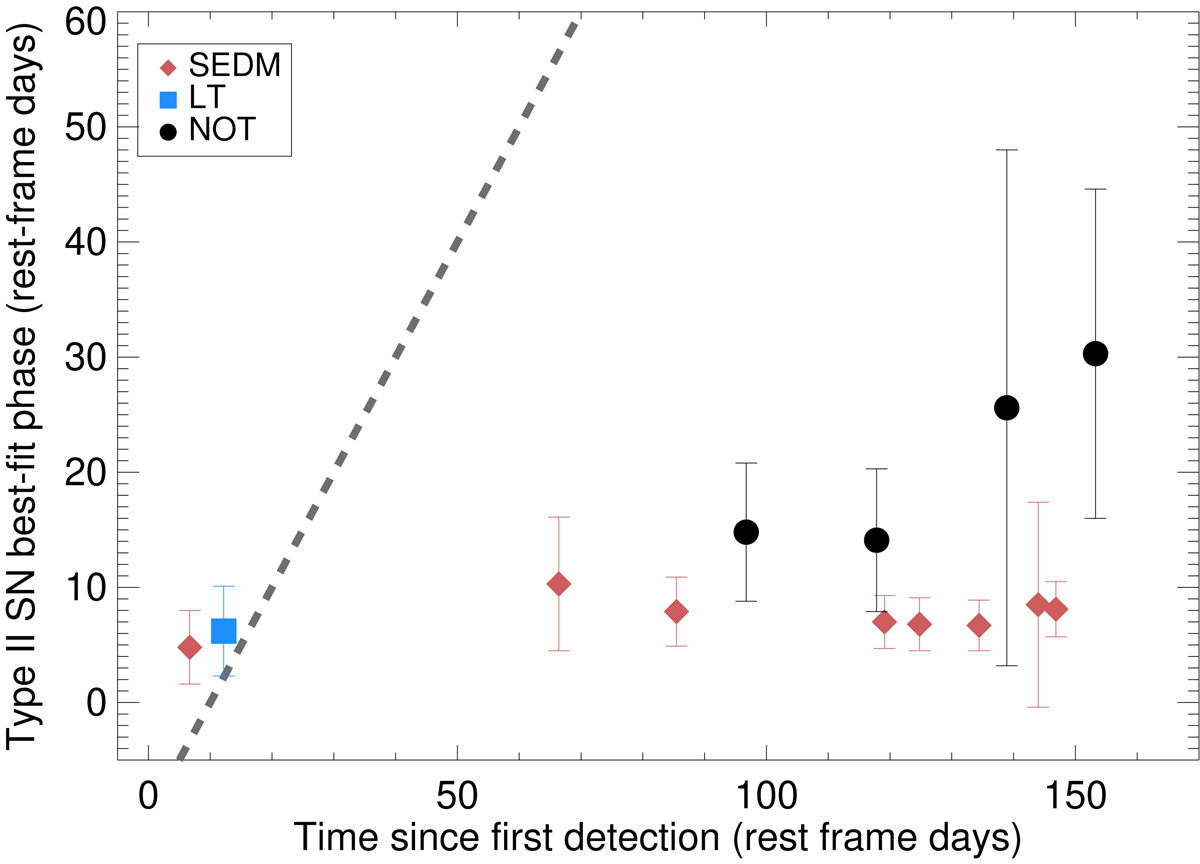
Phases estimated by comparison to superfit templates are plotted vs rest frame days since the first detection of SN 2020faa. The overall spectral evolution revealed by these comparisons is very slow, and even at more than 100 days the best matches are with younger Type II SNe. This is similar to what was found by A17 for iPTF14hls, which continued to display slow evolution for 600+ days. The dashed line shows the expected evolution where the phases would match, assuming a typical time between explosion and peak of ten days.
Current usage metrics show cumulative count of Article Views (full-text article views including HTML views, PDF and ePub downloads, according to the available data) and Abstracts Views on Vision4Press platform.
Data correspond to usage on the plateform after 2015. The current usage metrics is available 48-96 hours after online publication and is updated daily on week days.
Initial download of the metrics may take a while.