Free Access
Fig. 6.
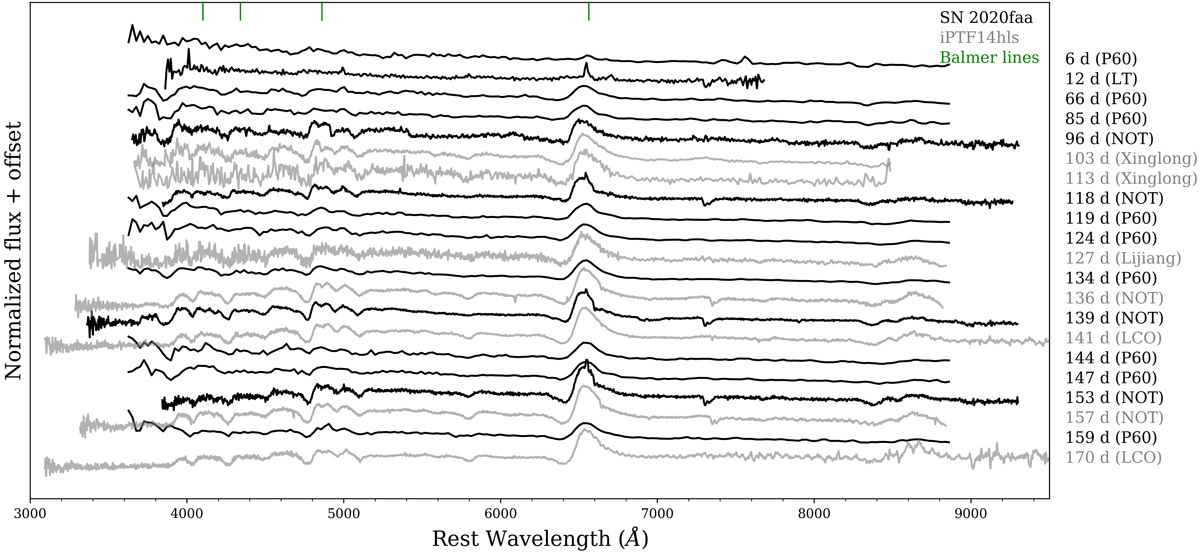
Sequence of optical spectra for SN 2020faa (in black). The complete log of spectra is provided in Table 1. The epoch of the spectrum is provided to the right. For comparison, also shown are the spectra of iPTF14hls (in grey).
Current usage metrics show cumulative count of Article Views (full-text article views including HTML views, PDF and ePub downloads, according to the available data) and Abstracts Views on Vision4Press platform.
Data correspond to usage on the plateform after 2015. The current usage metrics is available 48-96 hours after online publication and is updated daily on week days.
Initial download of the metrics may take a while.