Fig. 5.
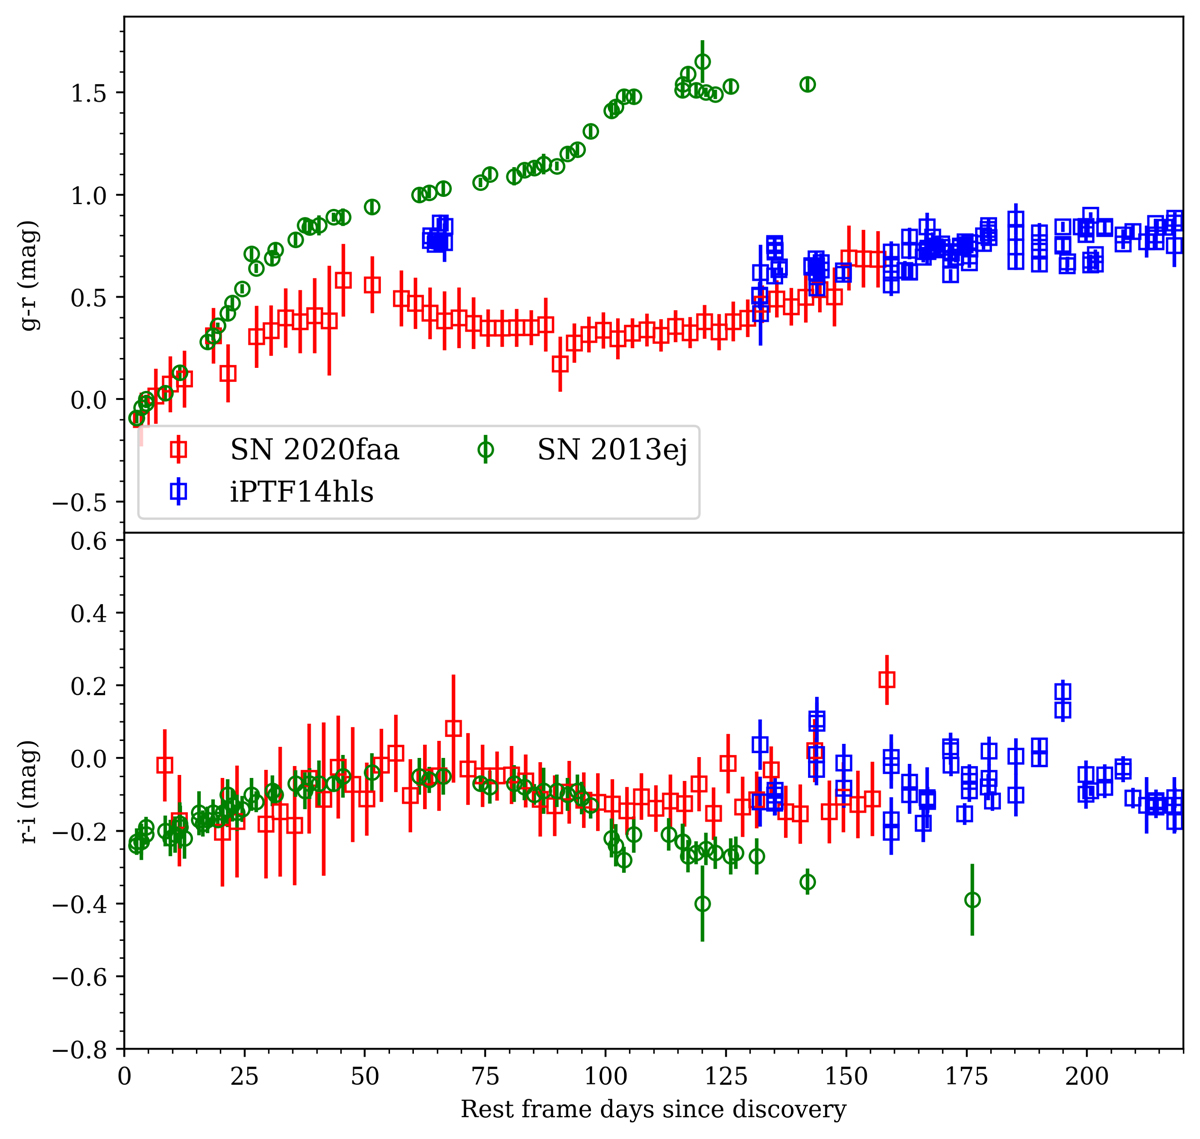
Colour evolution of SN 2020faa shown in g − r (upper panel) and r − i (lower panel), binned in three days. The colours have been corrected for MW extinction and are plotted in rest frame days relative to epoch of discovery. For comparison, also shown are the colours for iPTF14hls and for one normal Type II SN 2013ej, whose epochs are also provided in rest frame days since discovery.
Current usage metrics show cumulative count of Article Views (full-text article views including HTML views, PDF and ePub downloads, according to the available data) and Abstracts Views on Vision4Press platform.
Data correspond to usage on the plateform after 2015. The current usage metrics is available 48-96 hours after online publication and is updated daily on week days.
Initial download of the metrics may take a while.