Fig. 2.
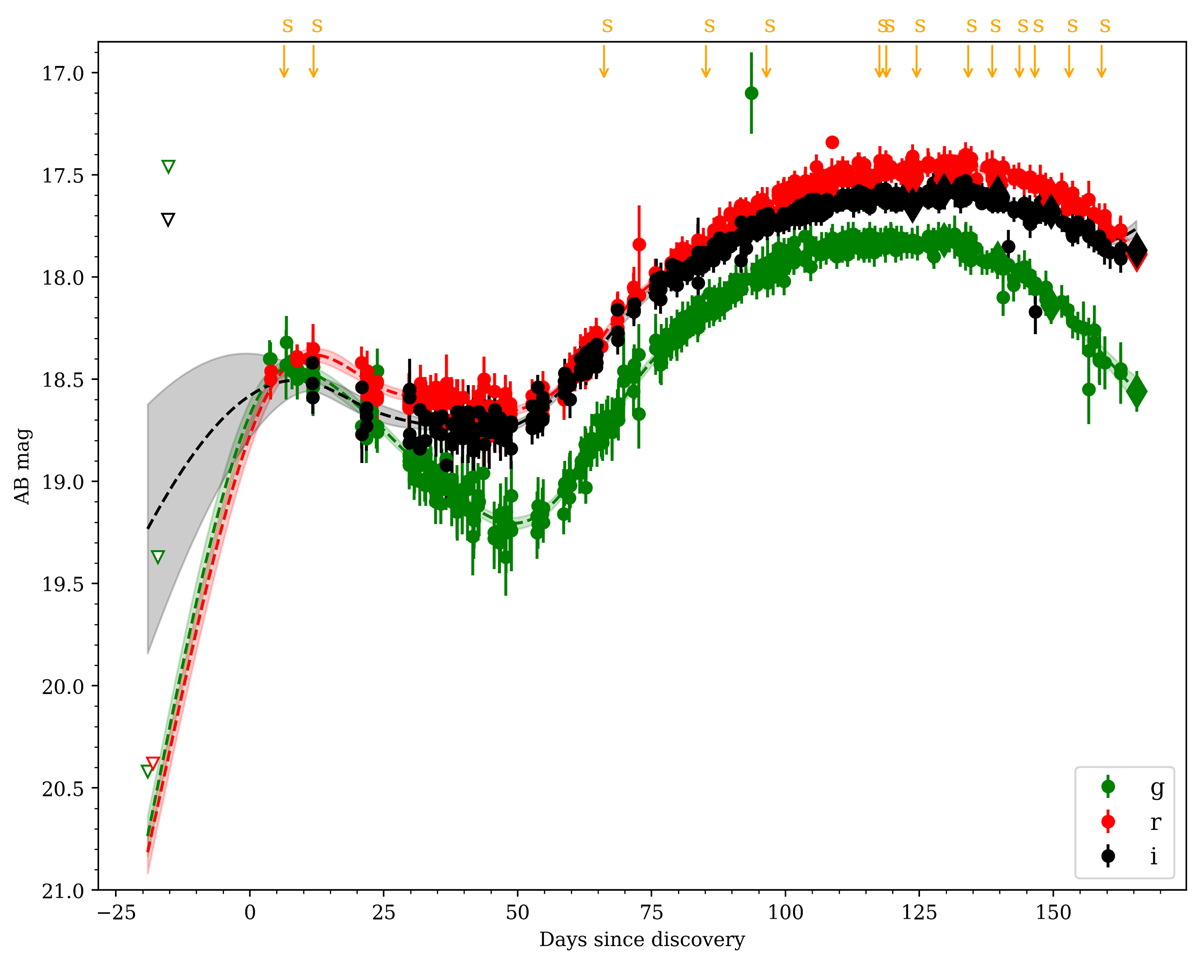
Light curves of SN 2020faa in g band (green), r band (red), and i band (black). Shown are observed (AB) magnitudes plotted vs the observer frame time in days since discovery. The yellow downward pointing arrows at the top indicate the epochs of spectroscopy, and the dashed lines with error regions are Gaussian processing estimates of the interpolated or extrapolated LCs. Relevant upper limits are shown to constrain the early phase of the LCs, displayed as inverted triangles.
Current usage metrics show cumulative count of Article Views (full-text article views including HTML views, PDF and ePub downloads, according to the available data) and Abstracts Views on Vision4Press platform.
Data correspond to usage on the plateform after 2015. The current usage metrics is available 48-96 hours after online publication and is updated daily on week days.
Initial download of the metrics may take a while.