Free Access
Fig. 9.
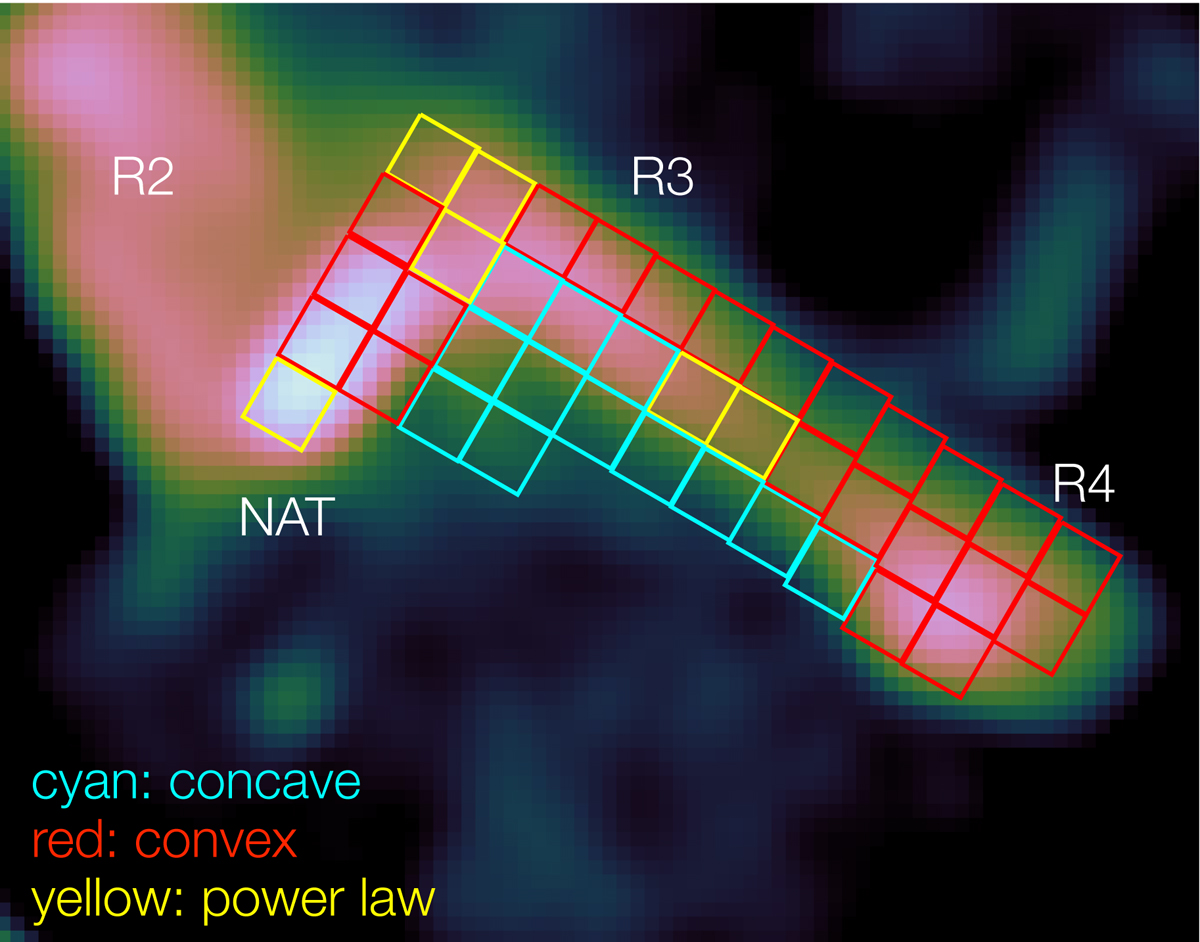
Spectra across the southern part of the relic and the NAT, overlaid on the L-band total intensity image. The different spectral shapes are evident. The long tails of the NAT show concave spectra, which could be due to the superposition of two different electron populations along the same line of sight.
Current usage metrics show cumulative count of Article Views (full-text article views including HTML views, PDF and ePub downloads, according to the available data) and Abstracts Views on Vision4Press platform.
Data correspond to usage on the plateform after 2015. The current usage metrics is available 48-96 hours after online publication and is updated daily on week days.
Initial download of the metrics may take a while.