Fig. 8.
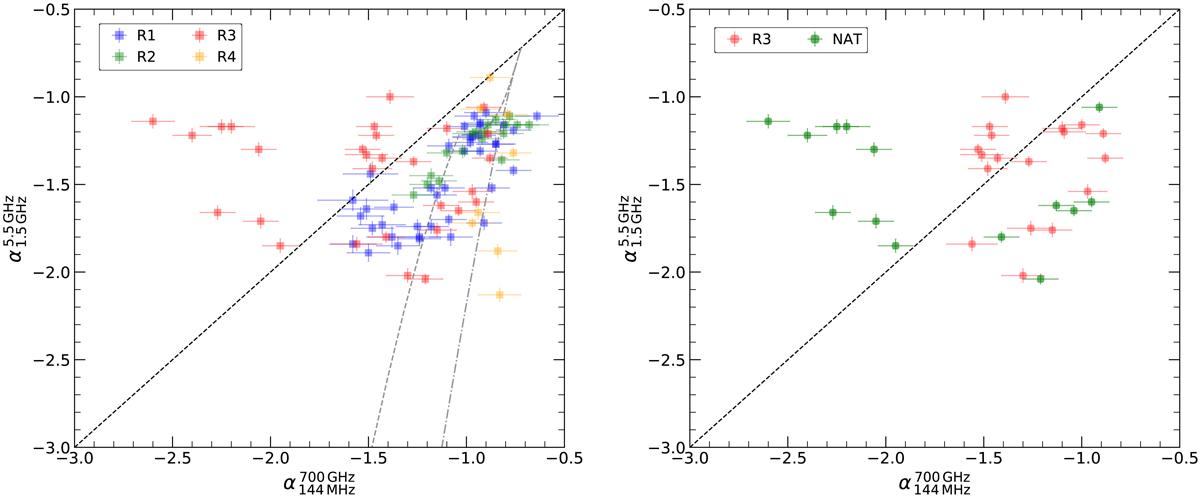
Radio color-color plots of the relic in MACS J0717.5+3745, superimposed with the JP (dash-dotted gray line) and KGJP (dashed gray line) spectral aging models obtained with αinj = −0.70. Left: majority of the relic points are below the power-law line, indicating negative spectral curvature. Many of the data points from the R3 region (red) of the relic lies in the concave part (positive curvature) of the color-color plot. The spectral curvature is not consistent with any of the standard spectral aging models. Right: color-color plot showing that the NAT and the R3 region of the relic have different spectral shapes, suggesting two overlapping components along the line of sight. To extract spectral index values, a grid of squared boxes with a width of 4.8″, corresponding to a physical size of about 31 kpc, is created.
Current usage metrics show cumulative count of Article Views (full-text article views including HTML views, PDF and ePub downloads, according to the available data) and Abstracts Views on Vision4Press platform.
Data correspond to usage on the plateform after 2015. The current usage metrics is available 48-96 hours after online publication and is updated daily on week days.
Initial download of the metrics may take a while.