Fig. 6.
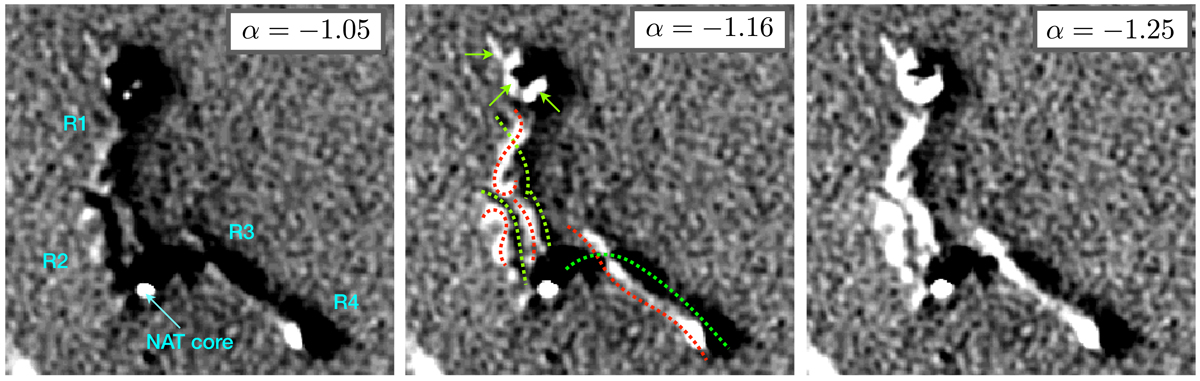
Gallery of spectral tomography maps between 1.5 and 5.5 GHz at 2.5″ resolution. The images demonstrate that there are structures with different spectral indices overlapping with each other (shown with dashed red and green lines). The red lines in each frame indicate spectra that are flatter than the listed αi, while the green lines indicate spectra steeper than the αi. This implies that the relic is composed of multiple overlapping structures. The small-scale structures are shown with green arrows. The emission with a spectrum steeper than αi appears positive (black regions), while flatter spectrum emission appears negative (white regions). The range in αi is −1.05, −1.16, and −1.25.
Current usage metrics show cumulative count of Article Views (full-text article views including HTML views, PDF and ePub downloads, according to the available data) and Abstracts Views on Vision4Press platform.
Data correspond to usage on the plateform after 2015. The current usage metrics is available 48-96 hours after online publication and is updated daily on week days.
Initial download of the metrics may take a while.