Fig. 3.
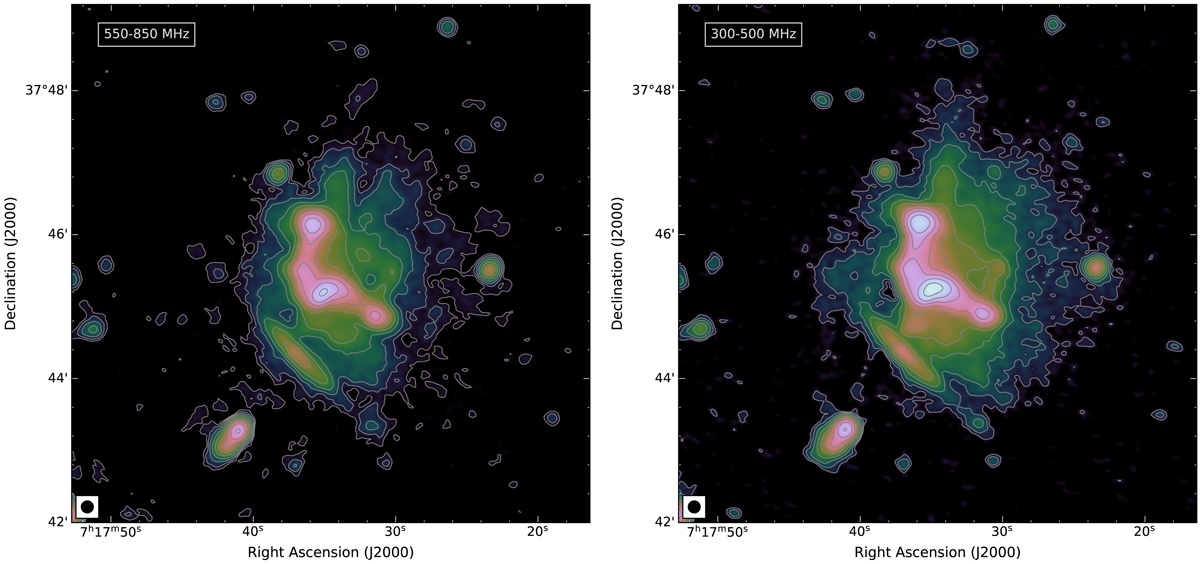
Low-resolution uGMRT images of the galaxy cluster MACS J0717+3745 showing the large-scale halo emission. The halo emission is more extended to the north and to the west than previously observed. Left: uGMRT 550−850 MHz image, which has a resolution of 10″ and a noise level of σrms, 700 MHz = 16 μJy beam−1. Right: uGMRT 300−500 MHz image, which has a beam size of 10″ and a noise level of σrms, 400 MHz = 27 μJy beam−1. Contour levels are drawn at [1, 2, 4, 8, …]×4.0σrms. In these images there is no region below −4.0σrms. Images are obtained using Briggs weighting with robust = 0.
Current usage metrics show cumulative count of Article Views (full-text article views including HTML views, PDF and ePub downloads, according to the available data) and Abstracts Views on Vision4Press platform.
Data correspond to usage on the plateform after 2015. The current usage metrics is available 48-96 hours after online publication and is updated daily on week days.
Initial download of the metrics may take a while.