Fig. 12.
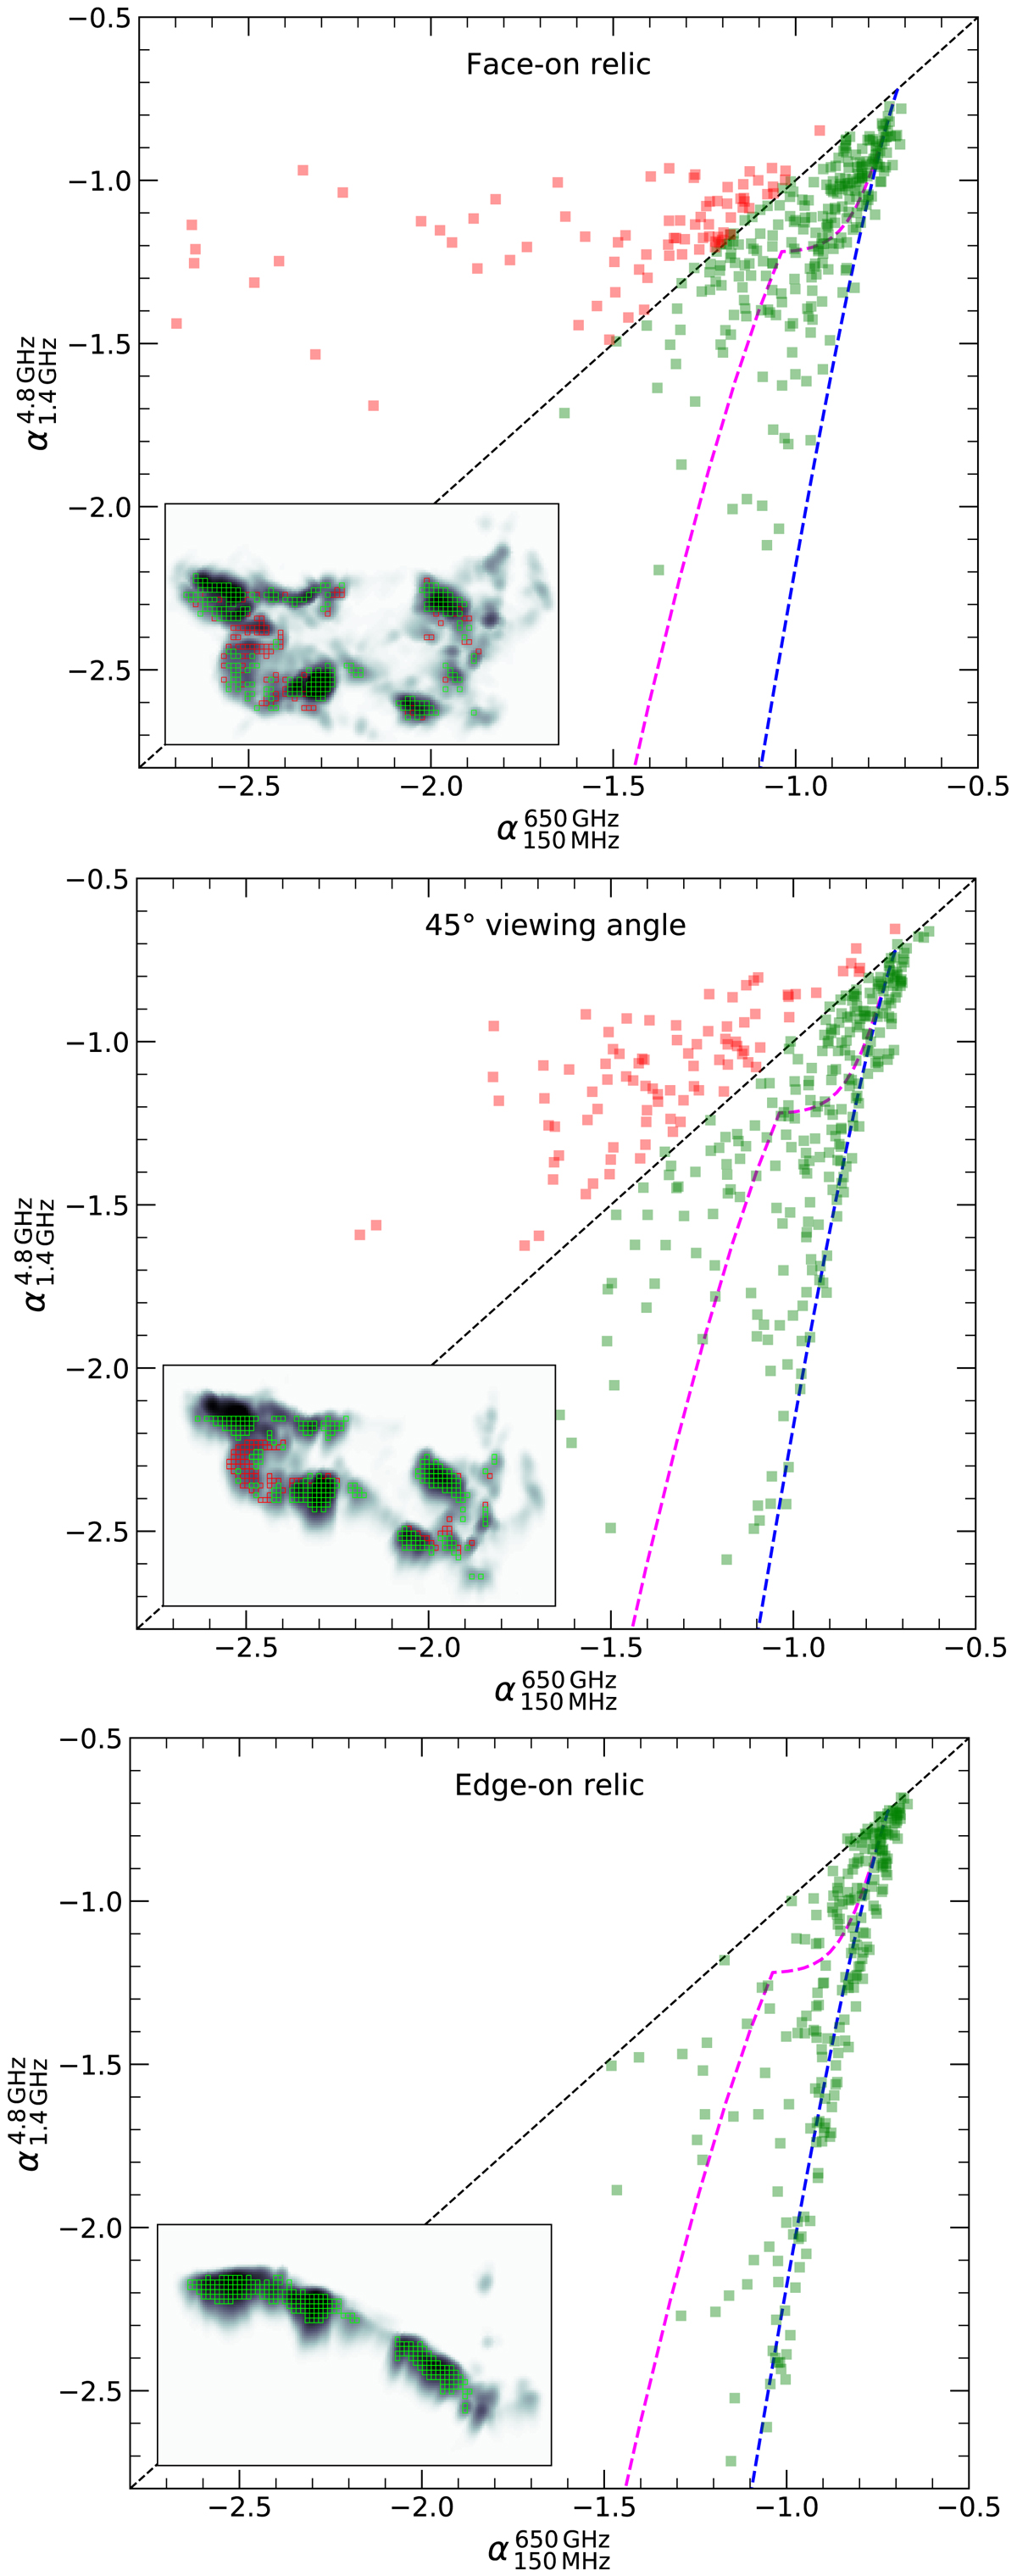
Radio color-color plots of the simulated relic from Wittor et al. (2019) at different viewing angles, superimposed with the JP (blue) and KGJP (magenta) spectral aging models obtained assuming αinj = −0.70. Top panel: face-on view of the relic, the middle panel at 45° viewing angle, and the bottom panel the edge-on view. The spectral indices are measured inside the ∼(15.8 kpc)2 boxes, as shown in the insets. The colors of the boxes match the colors of the points in the color-color plot; a red square is above the power-law line and a green square is below the power-law line. The plots reflect the differences in the spectral shapes of relics depending on the viewing angle.
Current usage metrics show cumulative count of Article Views (full-text article views including HTML views, PDF and ePub downloads, according to the available data) and Abstracts Views on Vision4Press platform.
Data correspond to usage on the plateform after 2015. The current usage metrics is available 48-96 hours after online publication and is updated daily on week days.
Initial download of the metrics may take a while.