Fig. 11.
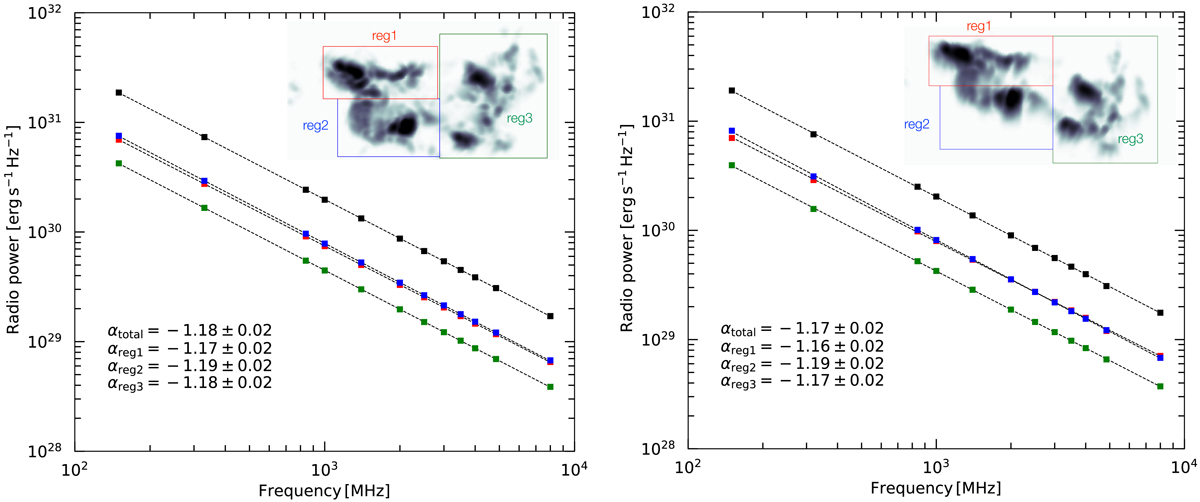
Integrated spectra of the relic when seen face-on (left) and at 45° viewing angle (right), simulated in Wittor et al. (2019). The black spectrum was measured across the whole relic, while the other spectra were taken in the different subregions as shown in the inset. The inset map gives the total intensity at 1.4 GHz. The simulated relic is ∼1.3 Mpc × 0.7 Mpc in size. Like an edge relic, the face-on and the 45° rotated relics also show almost similar spectral slopes. This implies that the integrated radio spectrum of relic is independent of the viewing angle. The integrated spectra of the relic seen edge-on is provided in Fig. 8 in Rajpurohit et al. (2020a).
Current usage metrics show cumulative count of Article Views (full-text article views including HTML views, PDF and ePub downloads, according to the available data) and Abstracts Views on Vision4Press platform.
Data correspond to usage on the plateform after 2015. The current usage metrics is available 48-96 hours after online publication and is updated daily on week days.
Initial download of the metrics may take a while.