Fig. 9
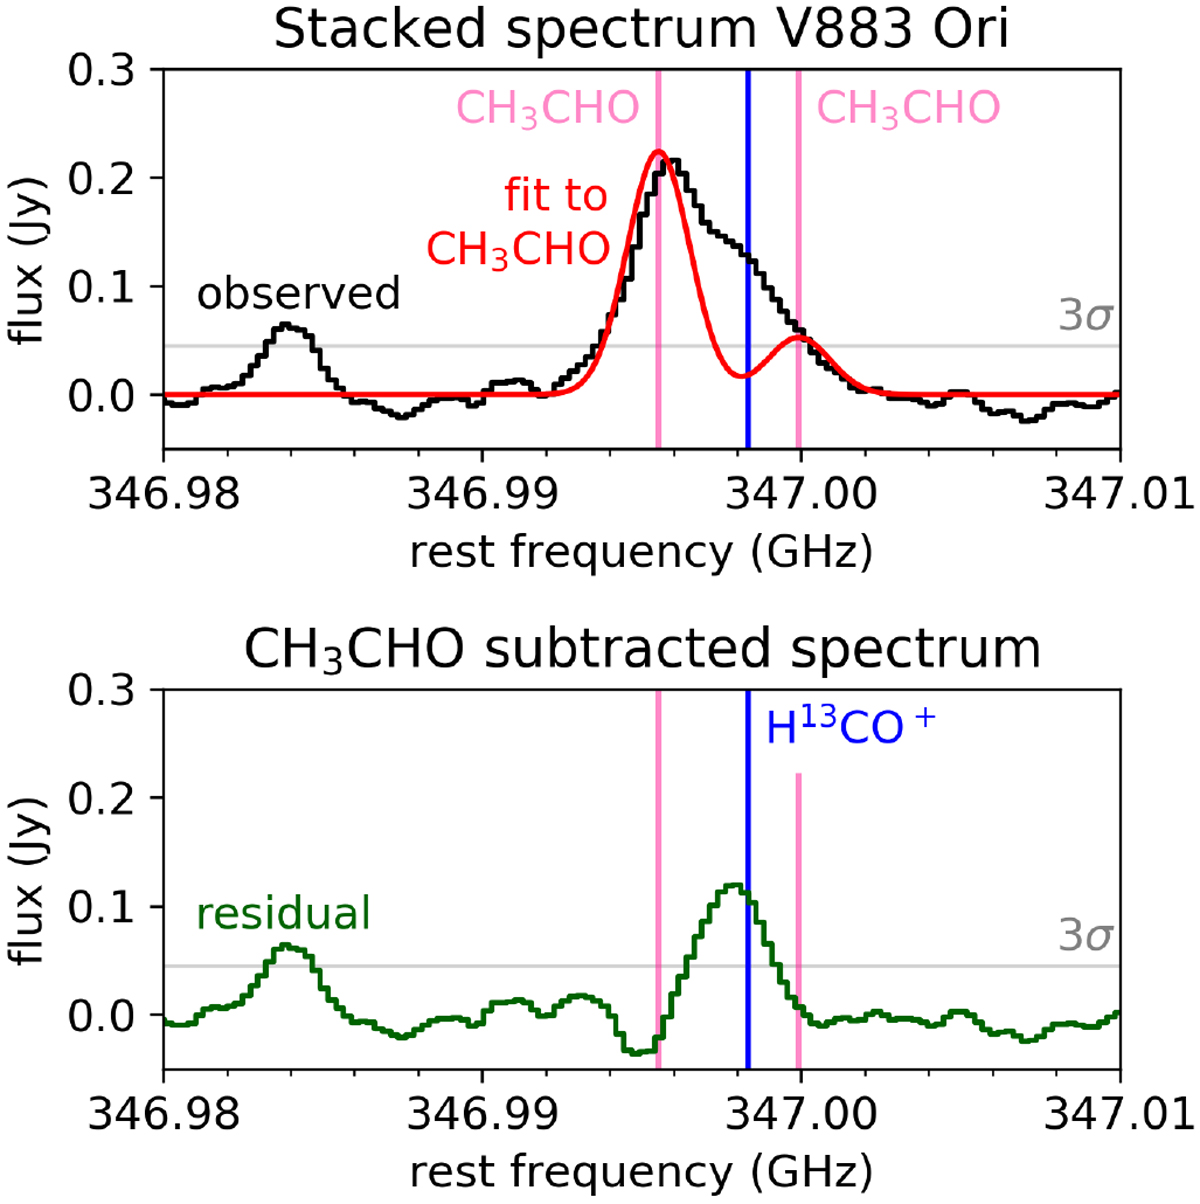
Observed and modelled spectrum of V883 Ori. Top panel: observed and stacked spectrum of V883 Ori (black) and a fit of the CH3CHO emission (red). Bottom panel: spectrum where the CH3CHO emission is subtracted. The H13CO+ J = 4− 3 emission line(vertical dark blue line) is blended with the CH3CHO lines (vertical pink lines). The 3σ noise level is indicated with the horizontal grey line.
Current usage metrics show cumulative count of Article Views (full-text article views including HTML views, PDF and ePub downloads, according to the available data) and Abstracts Views on Vision4Press platform.
Data correspond to usage on the plateform after 2015. The current usage metrics is available 48-96 hours after online publication and is updated daily on week days.
Initial download of the metrics may take a while.