Fig. 8
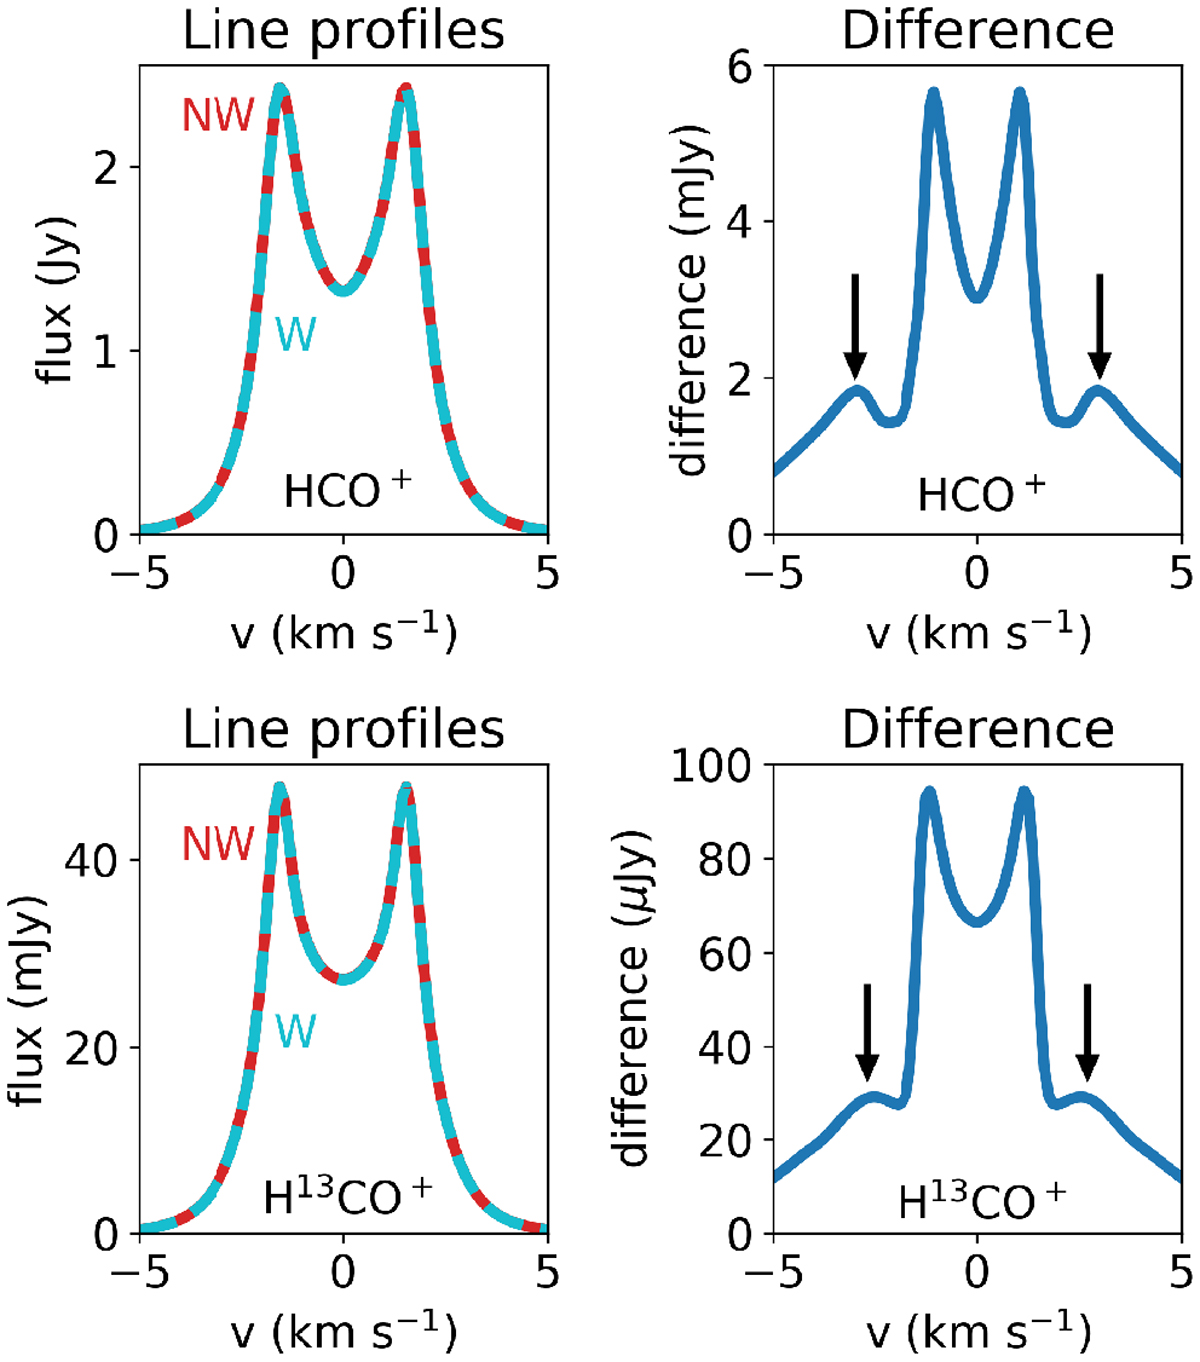
Predicted HCO+ and H13CO+ line profiles in a typical Herbig Ae disk. Left panels: line profile for the J = 2− 1 transition of HCO+ (top) and H13CO+ (bottom) forchemical network NW (red) and W (light blue). Right panels: difference between the line profiles in the left column. The black arrows indicate where the effect of the water snowline is expected. We note the differences in the vertical axes.
Current usage metrics show cumulative count of Article Views (full-text article views including HTML views, PDF and ePub downloads, according to the available data) and Abstracts Views on Vision4Press platform.
Data correspond to usage on the plateform after 2015. The current usage metrics is available 48-96 hours after online publication and is updated daily on week days.
Initial download of the metrics may take a while.