Fig. 6
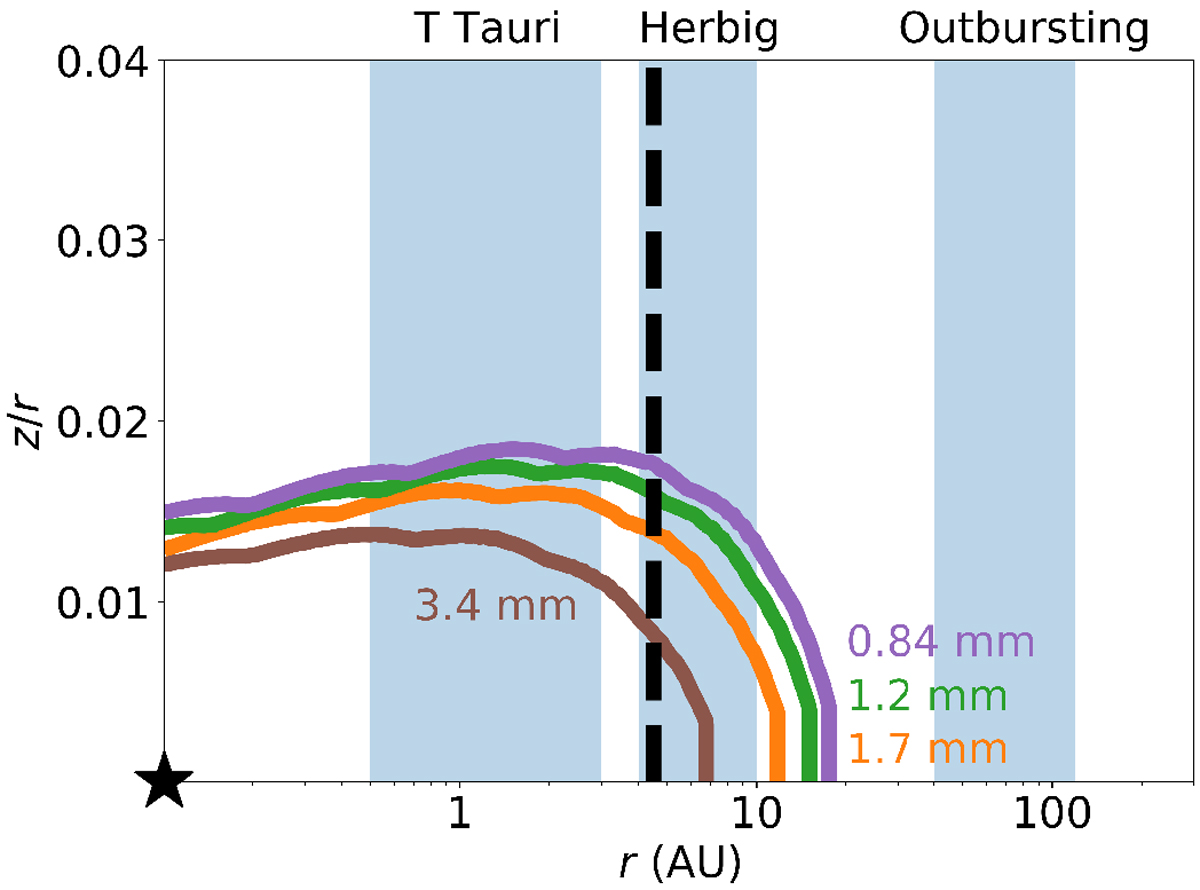
τdust = 1 surface at the wavelength of the HCO+ J = 1− 0 transition (3.4 mm, brown), J = 2−1 (1.7 mm, orange), J = 3−2 (1.2 mm, green), and J = 4−3 (0.84 mm, purple). The radial range where the water snowline is expected for various types of sources is highlighted with the blue background. The water snowline in the model for a typical Herbig Ae disk is indicated with the dashed black line.
Current usage metrics show cumulative count of Article Views (full-text article views including HTML views, PDF and ePub downloads, according to the available data) and Abstracts Views on Vision4Press platform.
Data correspond to usage on the plateform after 2015. The current usage metrics is available 48-96 hours after online publication and is updated daily on week days.
Initial download of the metrics may take a while.