Fig. 5
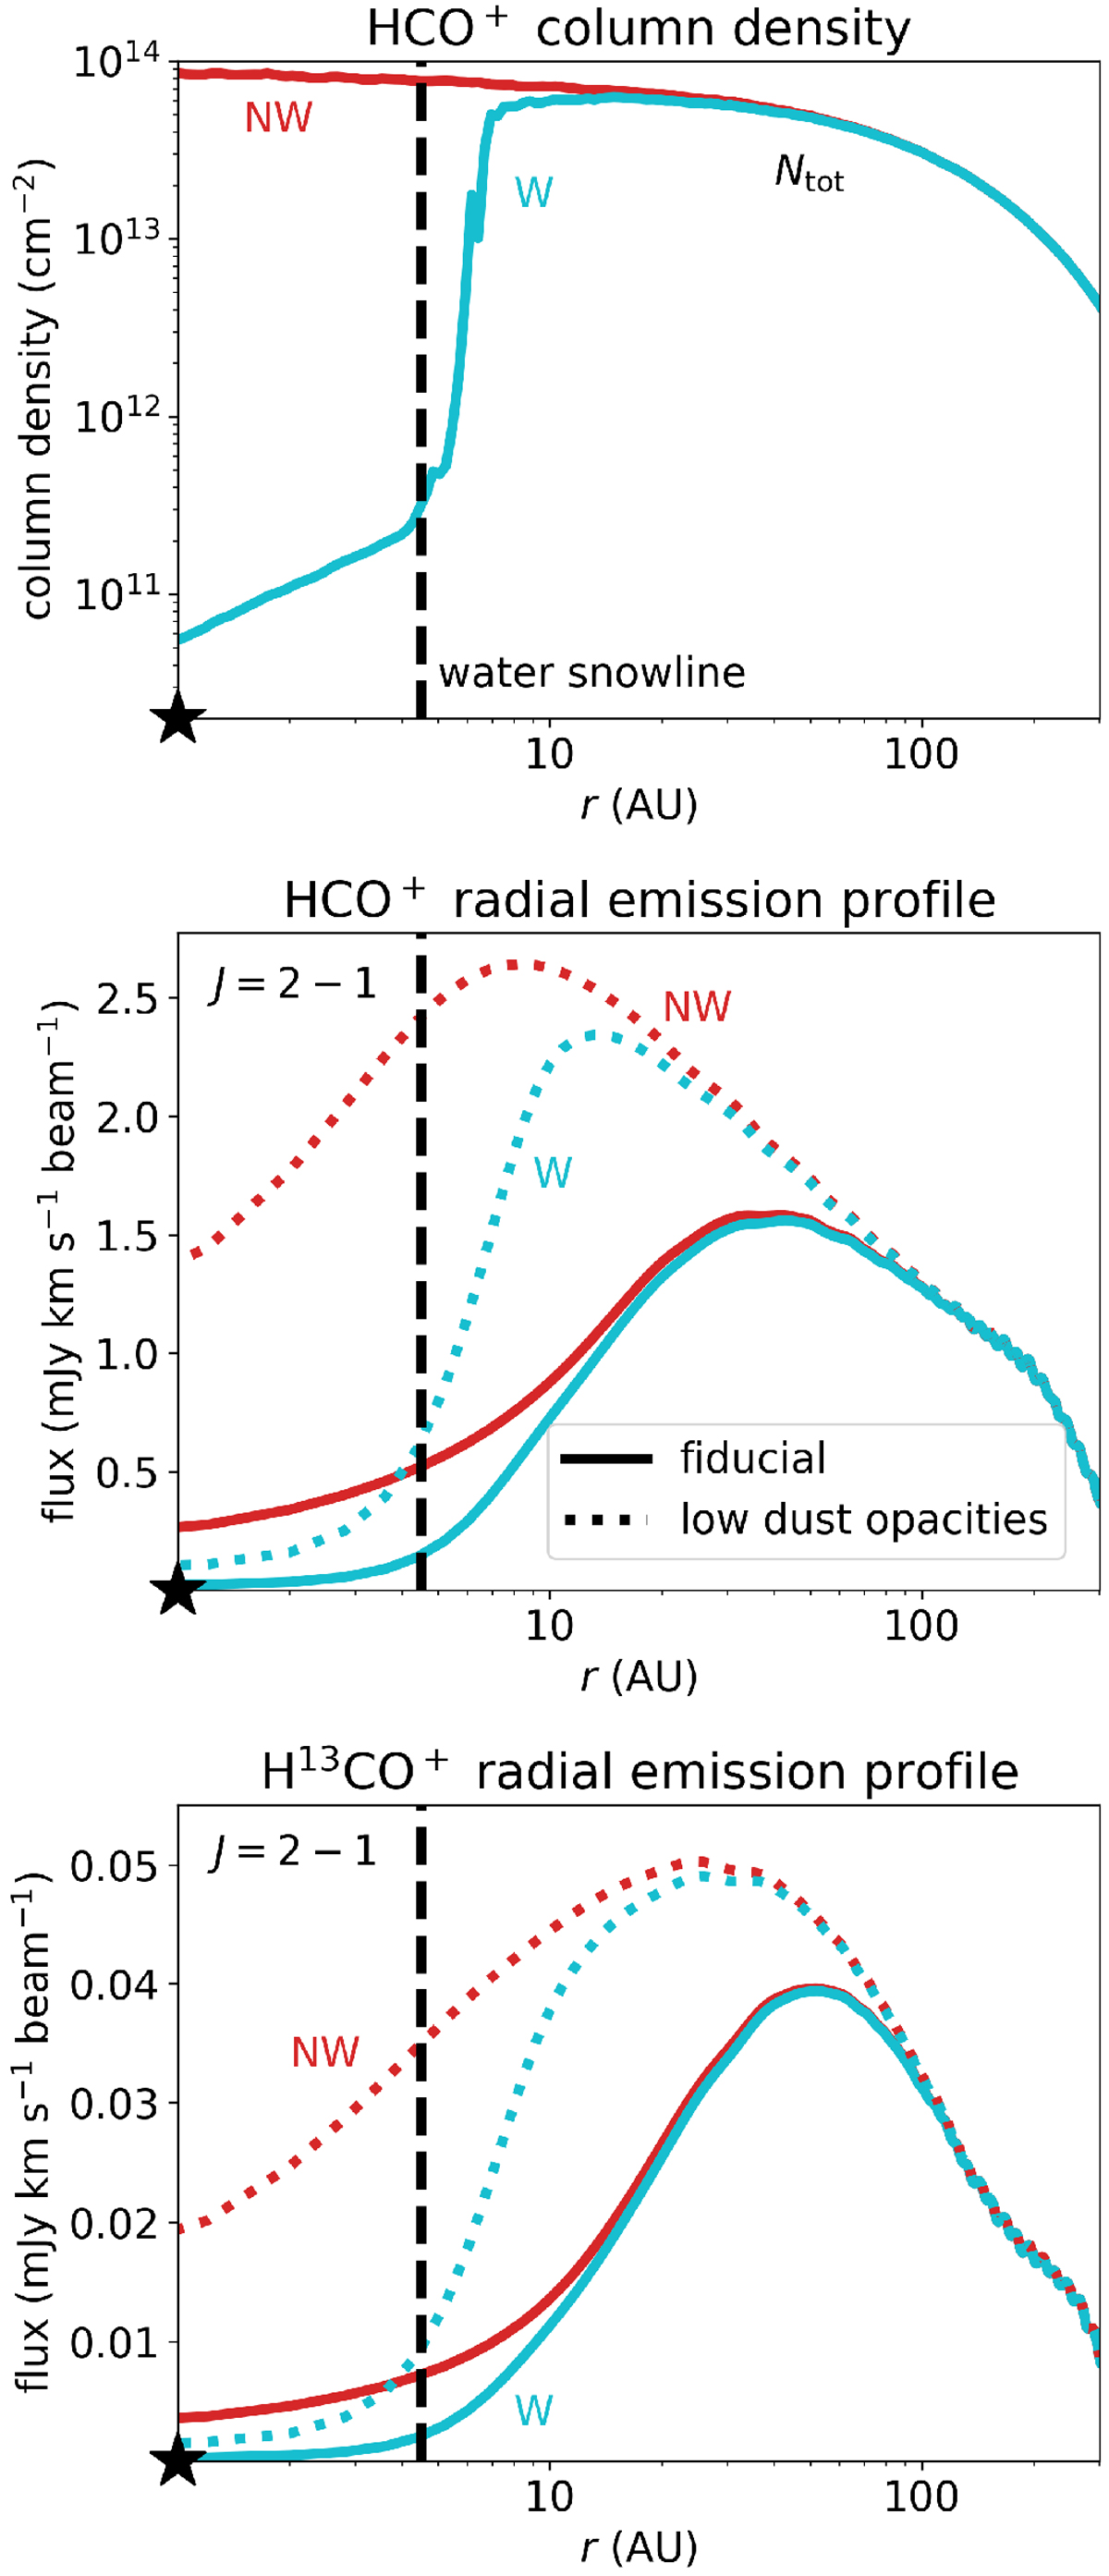
HCO+ column density and emission in a disk around a typical Herbig Ae star. Top panel: total HCO+ column densities. Middle and bottom panels: HCO+ J = 2− 1 radial emission profiles and H13CO+ J = 2− 1 radial emission profiles along the major axis predicted for chemical network NW (red) and chemical network W (light blue). The dotted lines refer to a model with very low dust opacities to lower the effects of continuum optical depth (see Sect. 3.2.1). The water snowline is indicated with the dashed black line. The radial emission profiles are convolved with a 0′′.05 beam.
Current usage metrics show cumulative count of Article Views (full-text article views including HTML views, PDF and ePub downloads, according to the available data) and Abstracts Views on Vision4Press platform.
Data correspond to usage on the plateform after 2015. The current usage metrics is available 48-96 hours after online publication and is updated daily on week days.
Initial download of the metrics may take a while.