Fig. 2
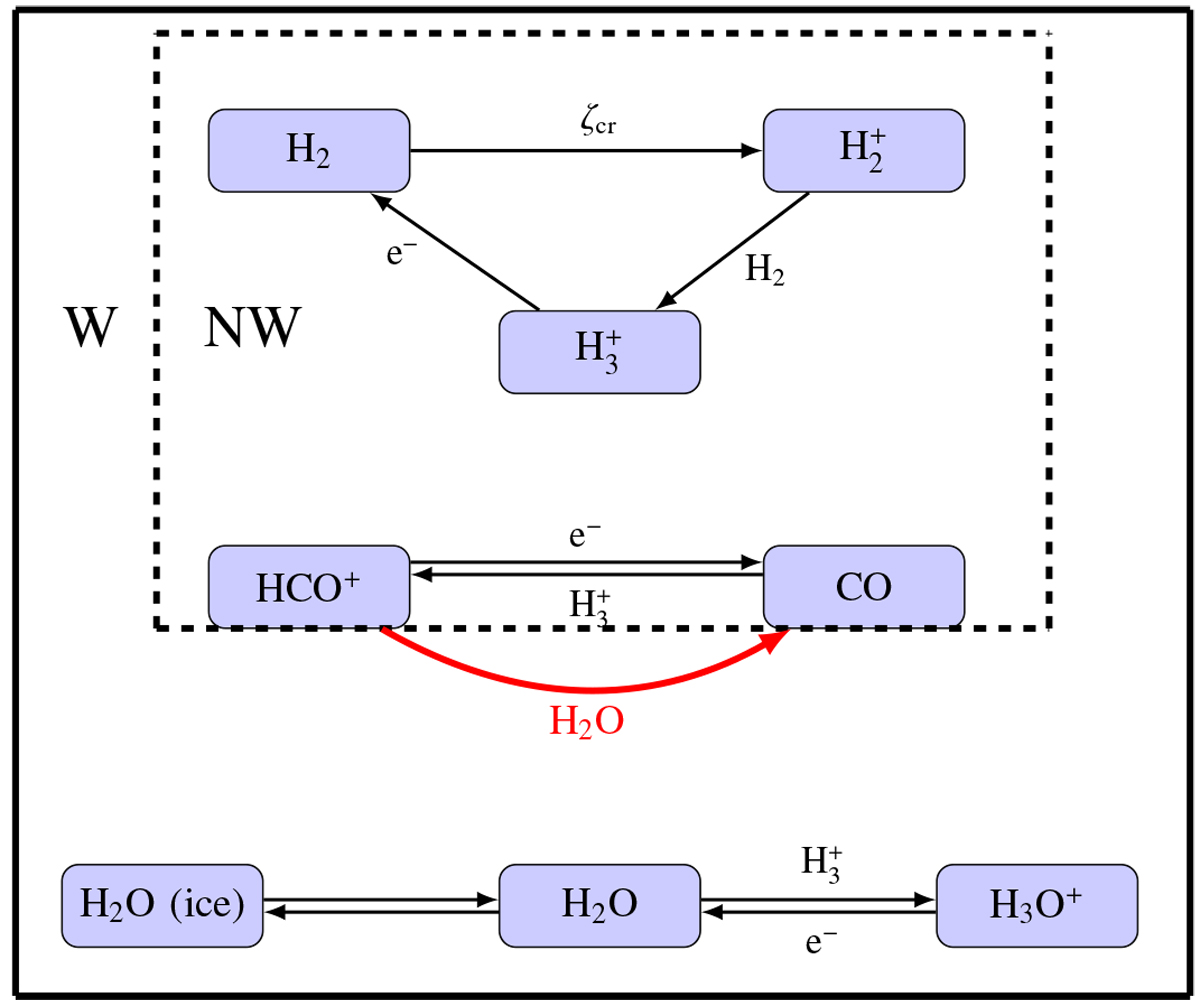
Schematic view of chemical networks NW (no water) and W (water) used to predict the abundance of HCO+. The first network, network NW, only includes the reactions enclosed in the dashed box. The second network, network W, includes all reactions present in the figure. The destruction of HCO+ by gas-phase water is indicated with the thick red arrow.
Current usage metrics show cumulative count of Article Views (full-text article views including HTML views, PDF and ePub downloads, according to the available data) and Abstracts Views on Vision4Press platform.
Data correspond to usage on the plateform after 2015. The current usage metrics is available 48-96 hours after online publication and is updated daily on week days.
Initial download of the metrics may take a while.