Fig. B.1
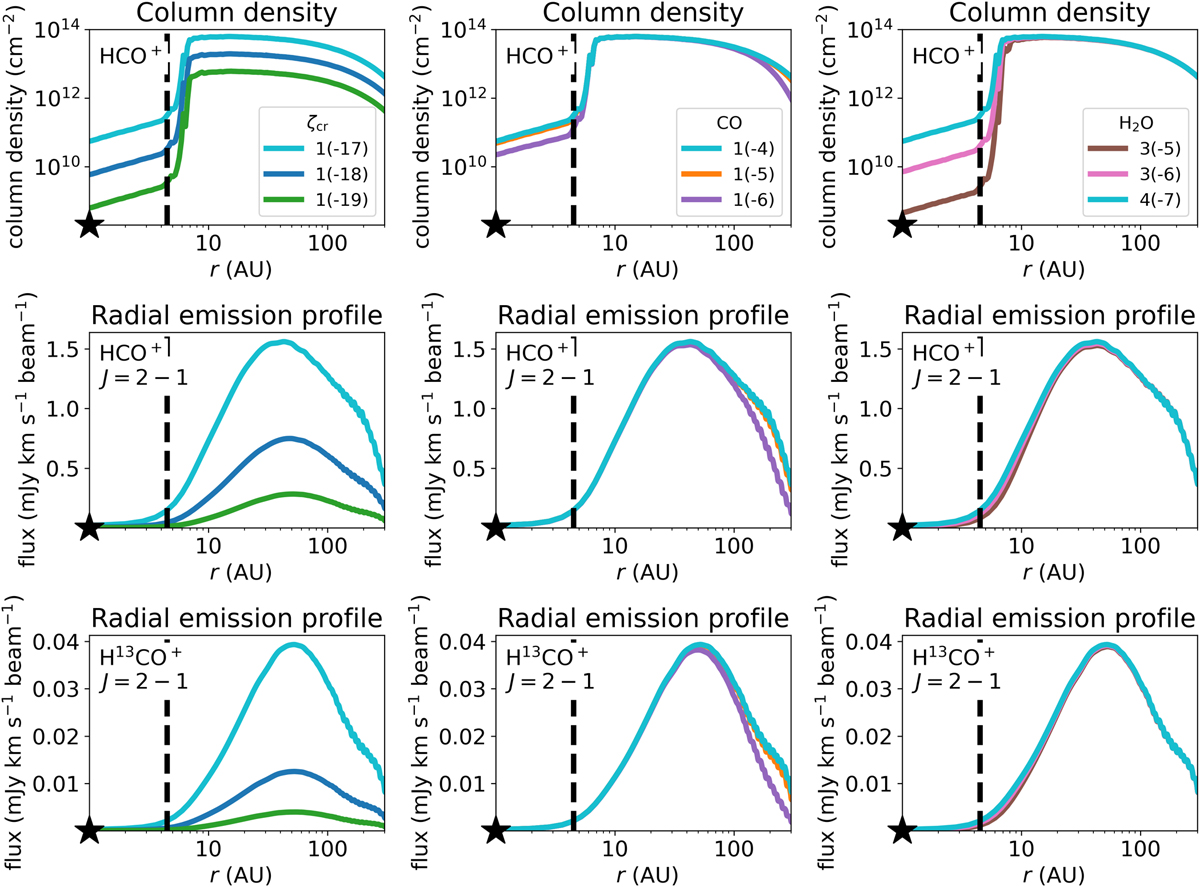
HCO+ column densities for different initial conditions in chemical network W (top row) and the corresponding radial emission profiles for the J = 2−1 transition of HCO+ (middle row) and H13CO+ (bottom row). Left-hand column: results for a cosmic ray ionisation rate of 10−17, 10−18, and 10−19s−1. Middle column: corresponding models for an initial CO abundance of 10−4, 10−5, and 10−6. Right-hand column: corresponding models for an initial abundance of gas-phase water of 3 × 10⁻⁵, 3 × 10⁻⁶, and 3.8 × 10⁻⁷. The fiducial model is indicated with the light blue line in each panel and uses an initial abundance of 3.8 × 10⁻⁷ for gas-phase water, 10−4 for gas-phase CO, and 10−17s−1 for the cosmic ray ionisation rate. The water snowline is indicated with a dashed black line and the position of the star is indicated by the symbol of a black star. The radial emission profiles are convolved with a 0′′.05 beam.
Current usage metrics show cumulative count of Article Views (full-text article views including HTML views, PDF and ePub downloads, according to the available data) and Abstracts Views on Vision4Press platform.
Data correspond to usage on the plateform after 2015. The current usage metrics is available 48-96 hours after online publication and is updated daily on week days.
Initial download of the metrics may take a while.