Fig. 11
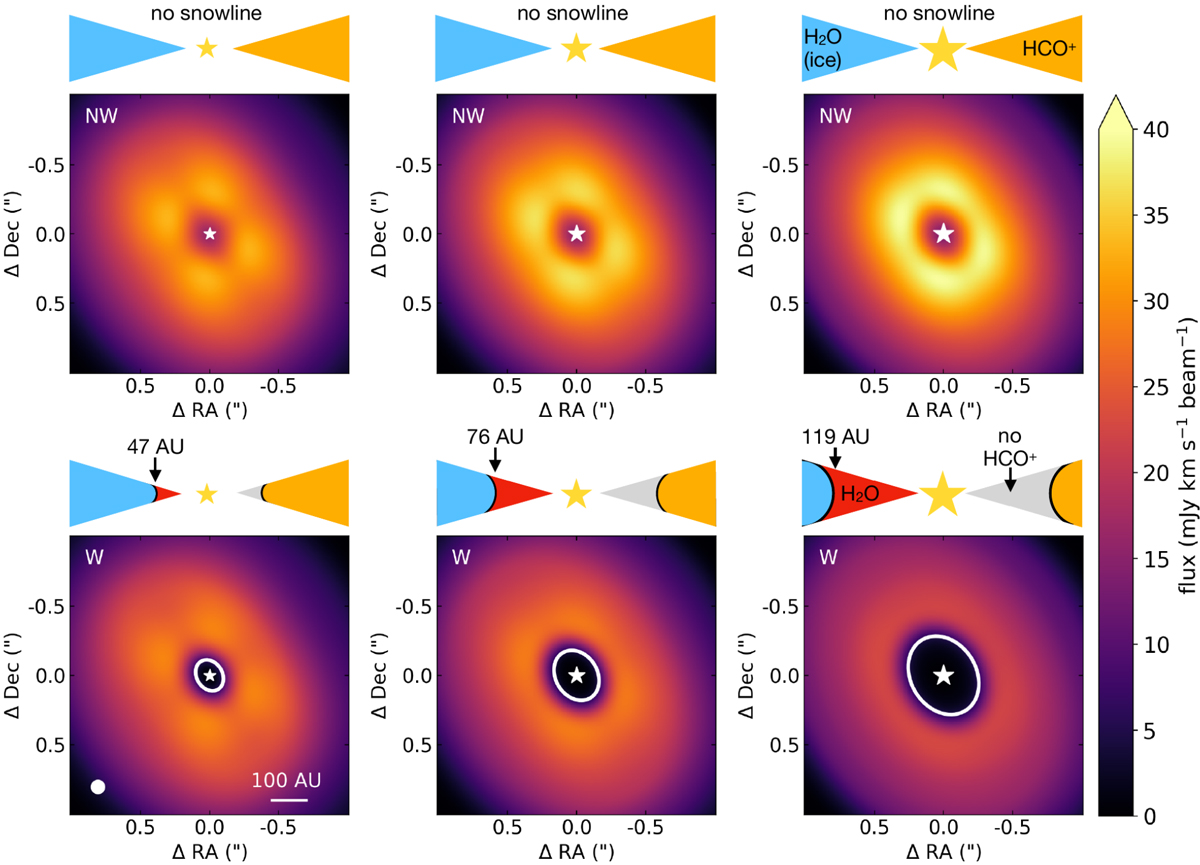
Integrated intensity maps for the J = 3−2 transition of HCO+ predicted by network NW (top row) and network W (bottom row). The snowline is indicated with a white ellipse and is located at 47 AU (left column), 76 AU (middle column), and 119 AU (right column). The cartoons above the individual panels provide a sketch of the model, where blue indicates water ice, red indicates gas-phase water, orange indicates a high abundance of HCO+, and grey indicates a low abundance of HCO+. The position of the star is marked with a yellow star in each cartoon and with white star in each panel. We note that the size of the star increases with increasing luminosity of the star. The 0′′.1 beam and a scale bar are indicated in the bottom left panel.
Current usage metrics show cumulative count of Article Views (full-text article views including HTML views, PDF and ePub downloads, according to the available data) and Abstracts Views on Vision4Press platform.
Data correspond to usage on the plateform after 2015. The current usage metrics is available 48-96 hours after online publication and is updated daily on week days.
Initial download of the metrics may take a while.