Fig. 10
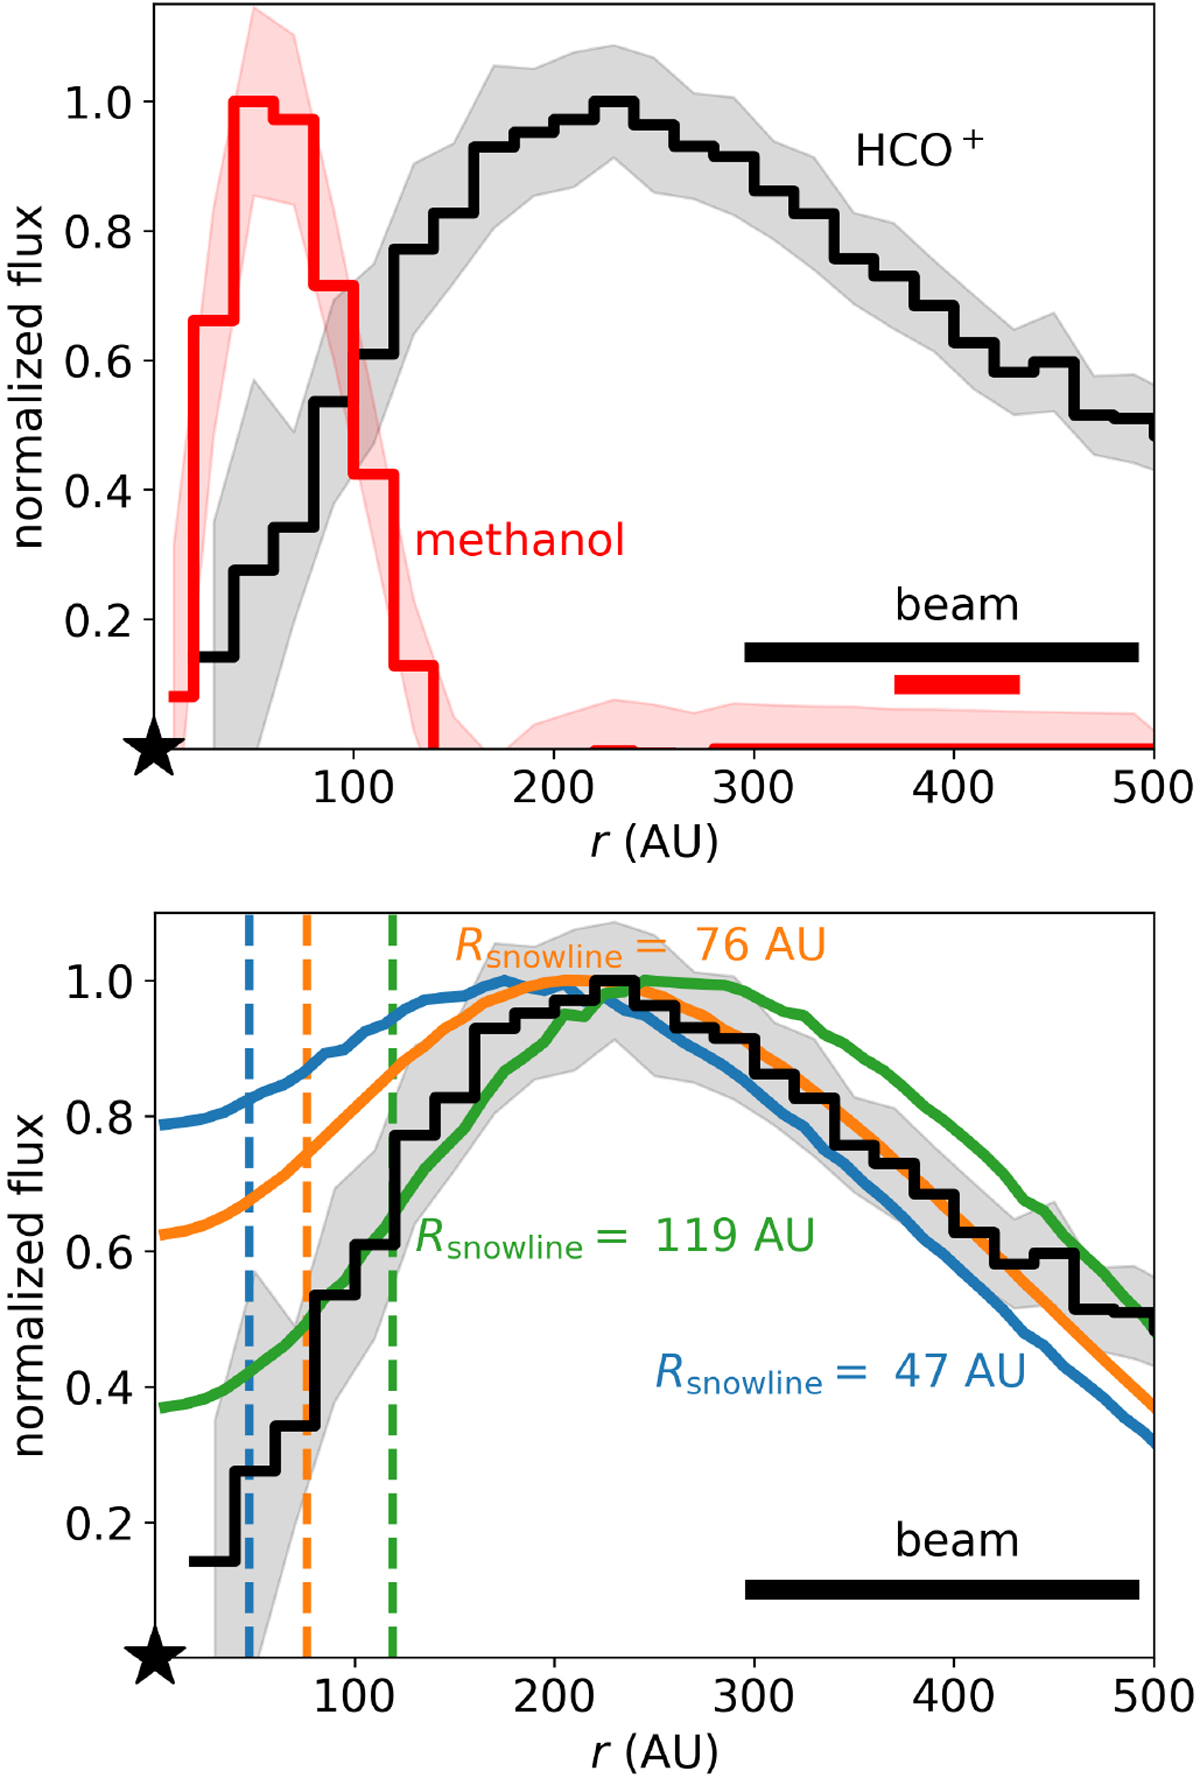
Observed and modelled emission from HCO+ J = 3− 2 and observed methanol in V883 Ori. Top: normalised azimuthal average of the observed HCO+ J = 3− 2 flux in V883 Ori (black; Ruíz-Rodríguez et al., in prep. and this work) and methanol 183 –174 flux (red; van ’t Hoff et al. 2018b). Bottom: normalised azimuthal average of the observed HCO+ flux (black; as in top panel) and modelled HCO+ flux for a snowline at 47 AU (blue), 76 AU (orange), and 119 AU (green). The snowline locations of the models are indicated with dashed lines in corresponding colours. The position of the star is indicated with a black star and the beam is indicated by the black bar in the bottom right corner.
Current usage metrics show cumulative count of Article Views (full-text article views including HTML views, PDF and ePub downloads, according to the available data) and Abstracts Views on Vision4Press platform.
Data correspond to usage on the plateform after 2015. The current usage metrics is available 48-96 hours after online publication and is updated daily on week days.
Initial download of the metrics may take a while.