Free Access
Fig. 7.
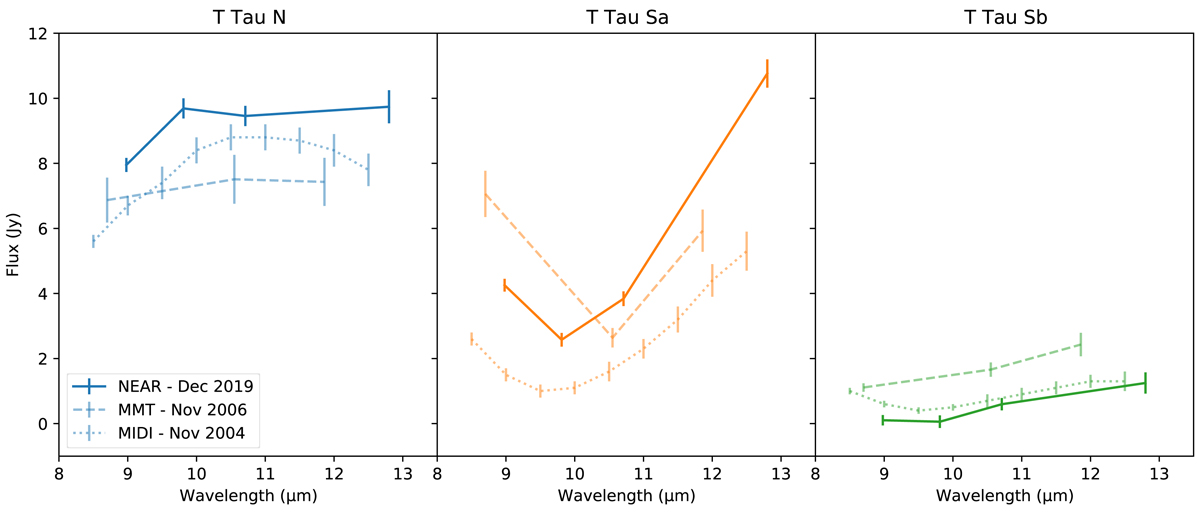
Photometry of T Tau N (blue curves), Sa (orange curves), and Sb (green curves) from ∼8–13 μm. There are VISIR-NEAR data from December 2019 (solid curves, this work), MMT data from November 2006 (dashed curves, Skemer et al. 2008), and MIDI data from November 2004 (dotted curves, Ratzka et al. 2009).
Current usage metrics show cumulative count of Article Views (full-text article views including HTML views, PDF and ePub downloads, according to the available data) and Abstracts Views on Vision4Press platform.
Data correspond to usage on the plateform after 2015. The current usage metrics is available 48-96 hours after online publication and is updated daily on week days.
Initial download of the metrics may take a while.