Fig. 3.
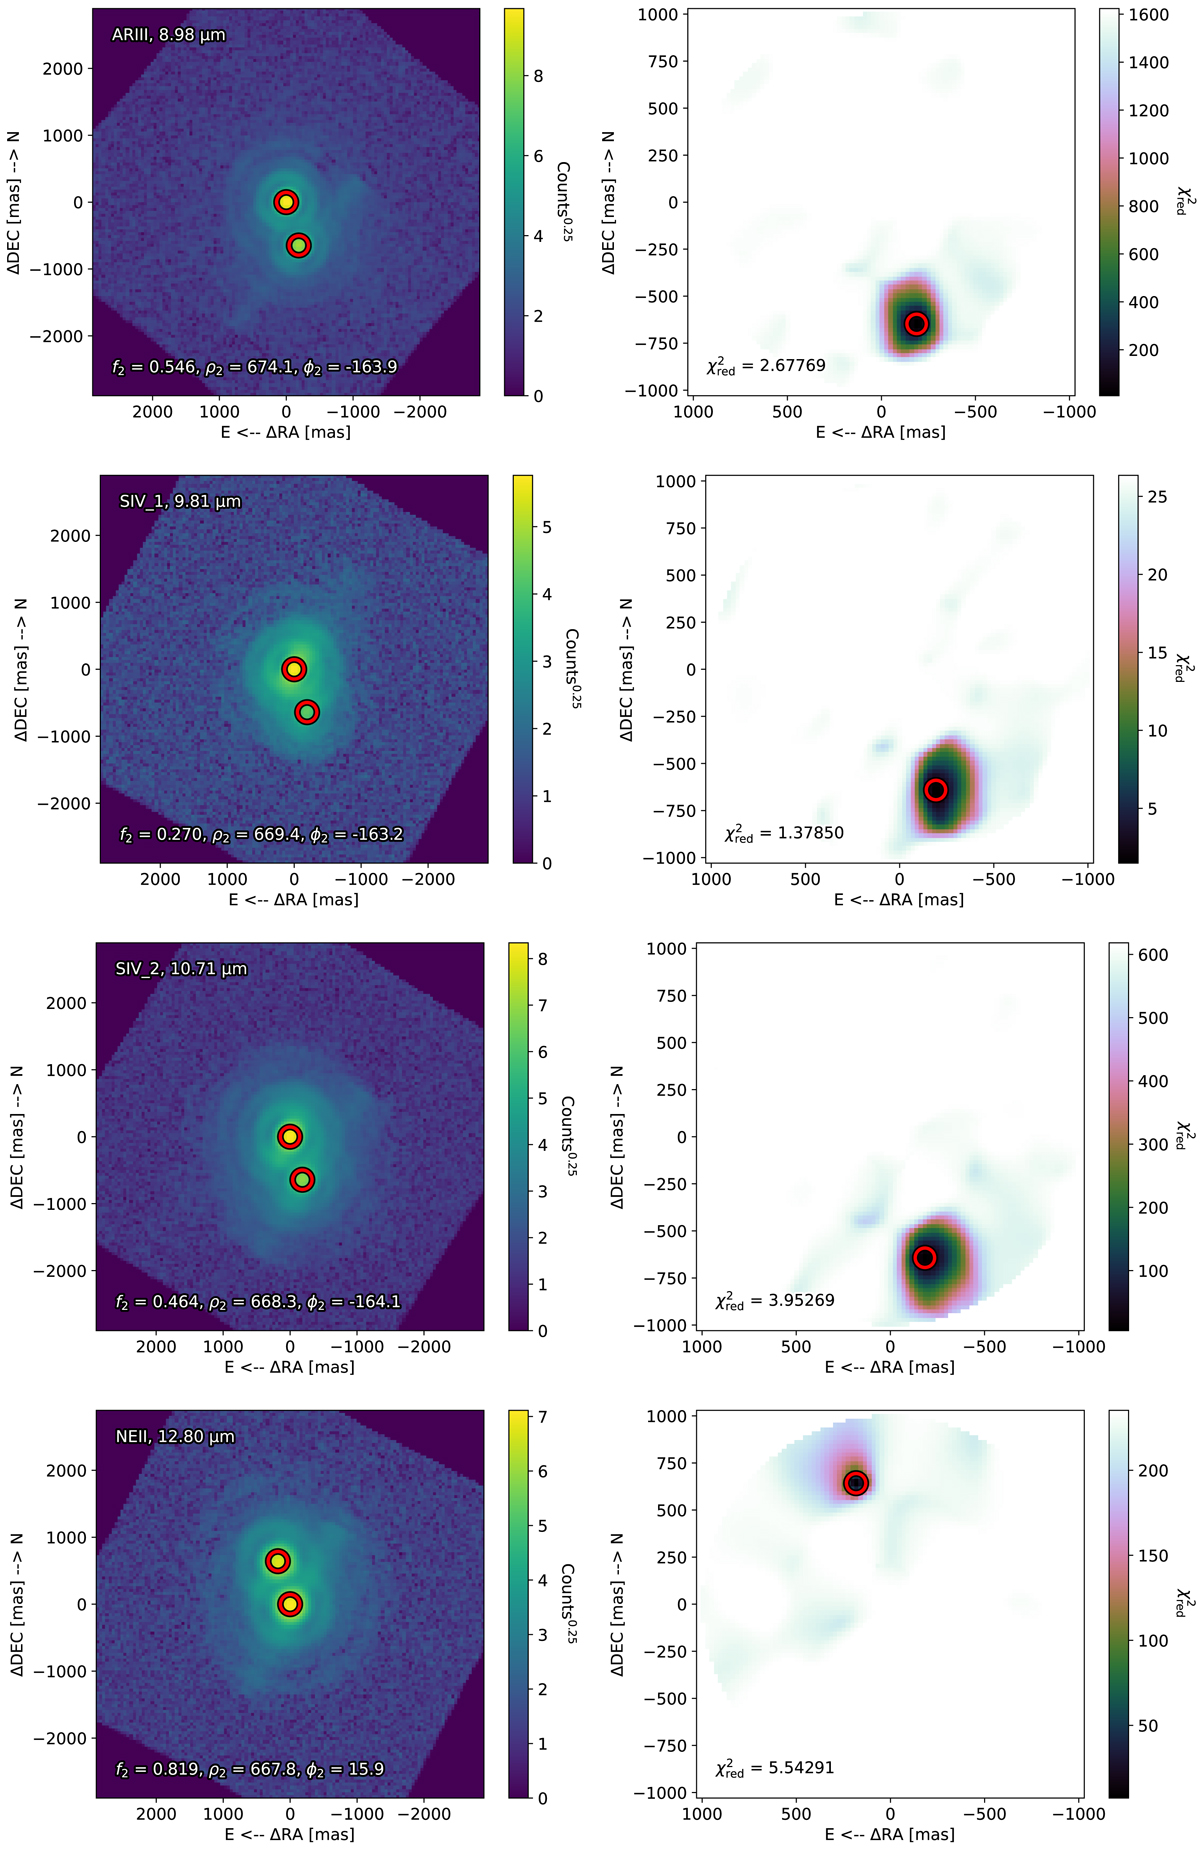
De-rotated and co-added VISIR-NEAR images of the T Tau triple system and the two-component fit (left-hand column, red circles) and the corresponding maps of the reduced χ2 (right-hand column) in the ARIII, SIV_1, SIV_2, and NEII filters (from top to bottom). In the right-hand panels, the red circle highlights the best fit position for the companion (here, the companion is assumed to be the combined PSF of T Tau Sa and Sb). The relative flux f2, the angular separation ρ2 [mas], and the position angle ϕ2 [deg] of the best fit are printed in the left-hand panels, and its reduced χ2 is printed in the right-hand panels. We note that the NEII data are centered on T Tau S, which is the brighter component at 12.80 μm.
Current usage metrics show cumulative count of Article Views (full-text article views including HTML views, PDF and ePub downloads, according to the available data) and Abstracts Views on Vision4Press platform.
Data correspond to usage on the plateform after 2015. The current usage metrics is available 48-96 hours after online publication and is updated daily on week days.
Initial download of the metrics may take a while.