Fig. 6.
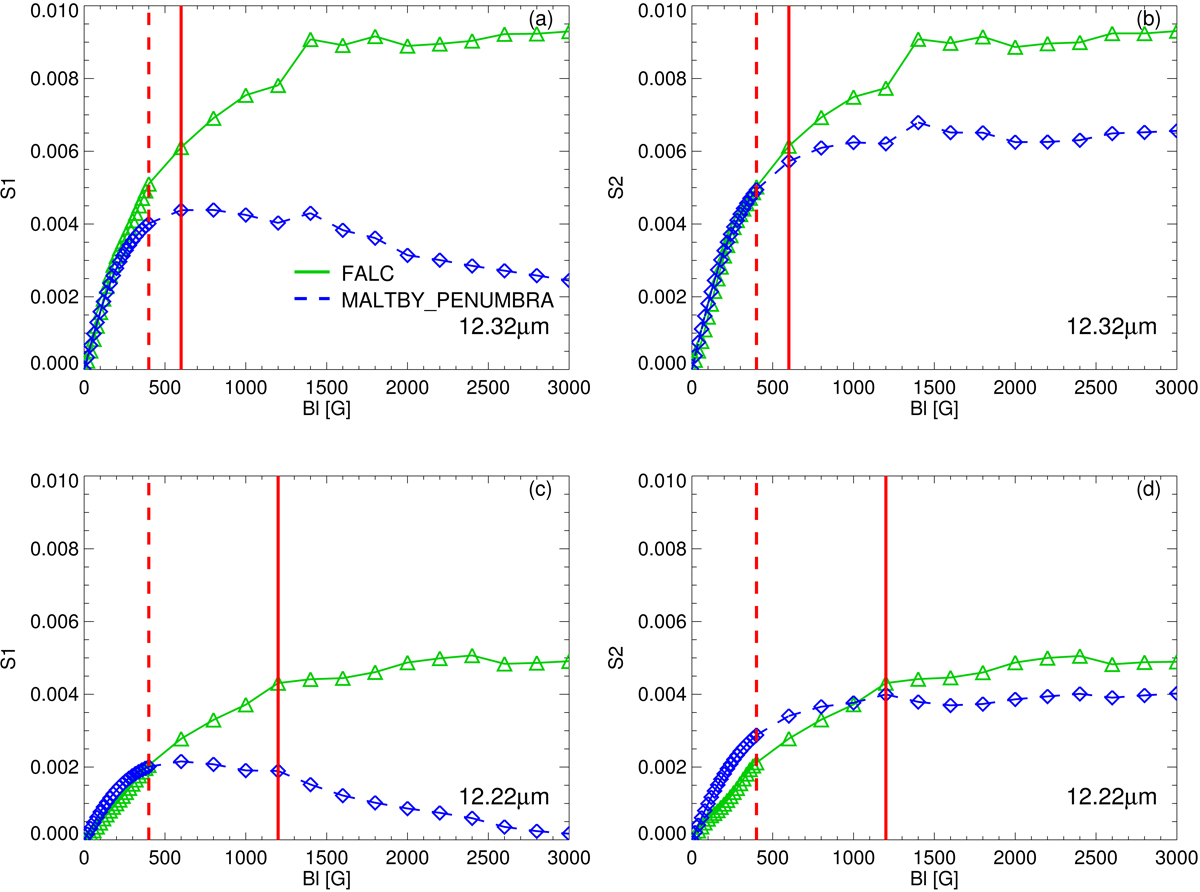
S–B curves of the Mg I 12.32 μm (top) and Mg I 12.22 μm (bottom) lines using different calculation methods in the FALC (solid green line, data points are denoted by triangles) and MALTBY (dashed blue line, data points are denoted by diamonds) models for Bl. S1 (left) and S2 (right) represent different wavelength-integrated methods (see Eqs. (1) and (2)). The vertical lines are used to divide the position that deviates from linearity in the FALC model (solid red) and MALTBY model (dashed red).
Current usage metrics show cumulative count of Article Views (full-text article views including HTML views, PDF and ePub downloads, according to the available data) and Abstracts Views on Vision4Press platform.
Data correspond to usage on the plateform after 2015. The current usage metrics is available 48-96 hours after online publication and is updated daily on week days.
Initial download of the metrics may take a while.