Fig. 9.
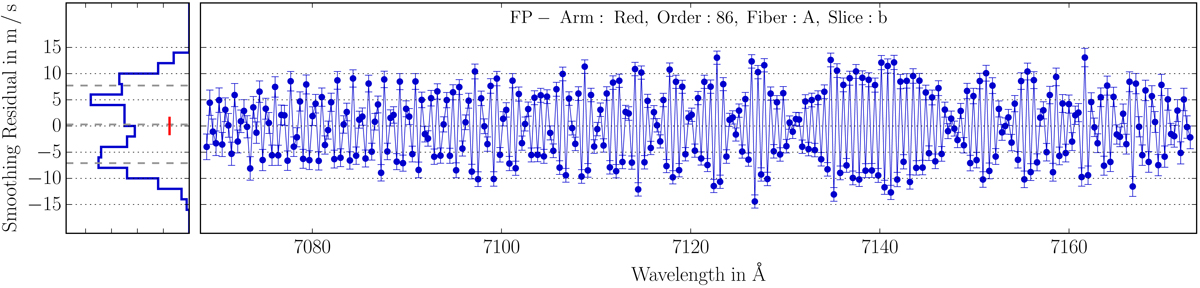
Position difference between locations of individual FP lines and a smooth wavelength solution. The smooth wavelength solution was obtained in a nonparametric way by applying a kernel smoothing filter (basically a low-pass) to the FP line positions. Individual points are connected with lines to better visualize the quasi-periodic behavior. The left panel shows a histogram of these smoothing residuals with indications for the 16th, 50th, and 84th percentile of the distribution. The mean formal position error of the lines is visualized by a red bar.
Current usage metrics show cumulative count of Article Views (full-text article views including HTML views, PDF and ePub downloads, according to the available data) and Abstracts Views on Vision4Press platform.
Data correspond to usage on the plateform after 2015. The current usage metrics is available 48-96 hours after online publication and is updated daily on week days.
Initial download of the metrics may take a while.