Fig. 8.
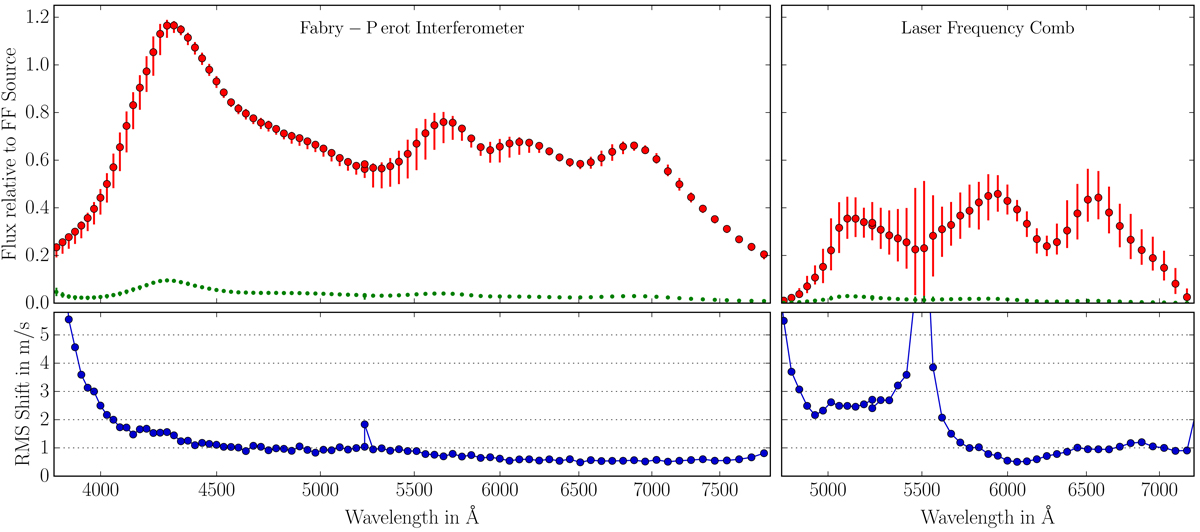
Flux envelope and background light characteristics of FP and LFC calibration light sources and the line centroid differences between the fits with and without background light subtraction. The top panels show for each spectral order the median and 95% range of flux envelope and background light, i.e., the statistical properties of flux and background light shown explicitly for two orders in Fig. 7. The bottom panels display per order the scatter of the centroid shifts, computed from the 16th–84th percentile range. For simplicity, only Slice a of Fiber A is shown.
Current usage metrics show cumulative count of Article Views (full-text article views including HTML views, PDF and ePub downloads, according to the available data) and Abstracts Views on Vision4Press platform.
Data correspond to usage on the plateform after 2015. The current usage metrics is available 48-96 hours after online publication and is updated daily on week days.
Initial download of the metrics may take a while.